
The forecasts in January 2023 were very cautious – but still came with an optimistic component: After a disappointing 2022 in stock market terms, there was certainly room for positive surprises! December is always one of the busiest months in the industry, but now is also an opportunity to take stock.
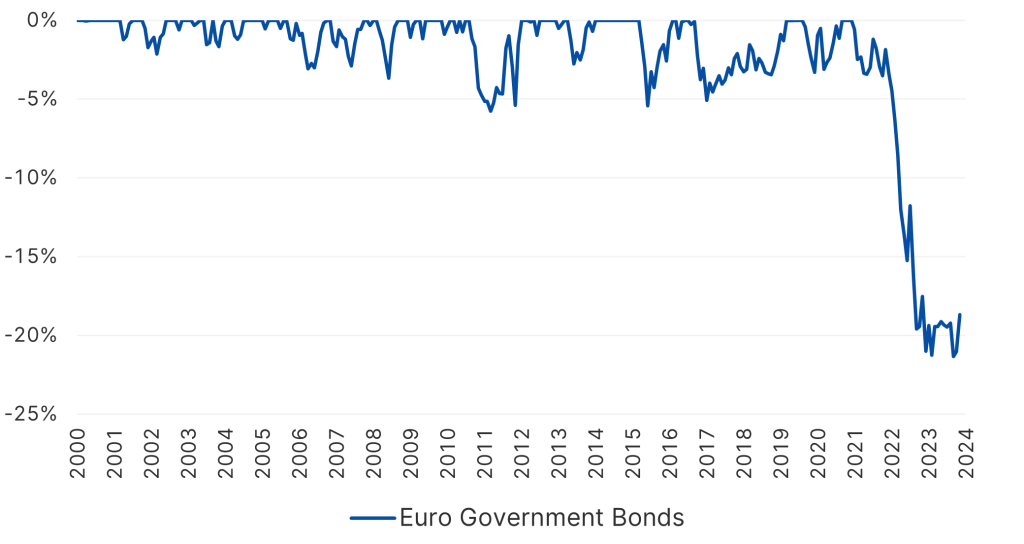
What comes and remains should be the renewed strength of bonds as a source of income. The following chart shows the loss phases for European government bonds in the past:
Loss phases for European government bonds
Note: Past performance is not a reliable indicator of future performance.
Source: Bloomberg; as at 20.12.2023; Index: ICE BofA Euro Government Index
Until 2022, government bonds (and the associated corporate bonds) went through limited periods of losses and quickly made up for them. The development from 2022 onwards stands out completely – it is the result of the massive interest rate hikes by the central banks. The current loss phase has not even come close to being recouped – this opens up a stable earnings opportunity for the future. In the wake of this, so-called mixed investment funds and asset allocation mandates should once again become more of a focus for investors.
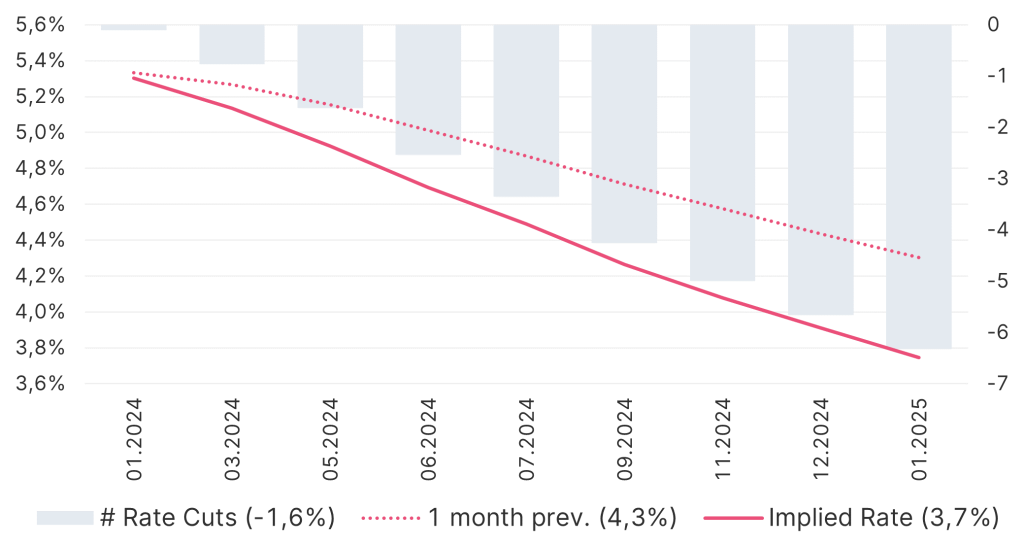
The expectation of future key interest rates can be seen on the financial markets. This assessment is, of course, a snapshot and is itself volatile, but it can nevertheless be an indicator for 2024. The following chart shows the picture for the USA:
Expectation of key interest rate development in the USA
Note: Past performance is not a reliable indicator of future performance.
Source: Bloomberg; as at 20.12.2023
Interest rates are expected to be cut by a total of 1.6% over the course of the year, meaning that the key interest rate would be in the region of 3.7% at the end of the year. Just one month ago, this expectation was around 4.3%. In the past 1-2 years, the financial markets have predicted a trend reversal in the US Federal Reserve’s approach 7 times (so-called “Fed pivot”), but now this expectation could materialize.
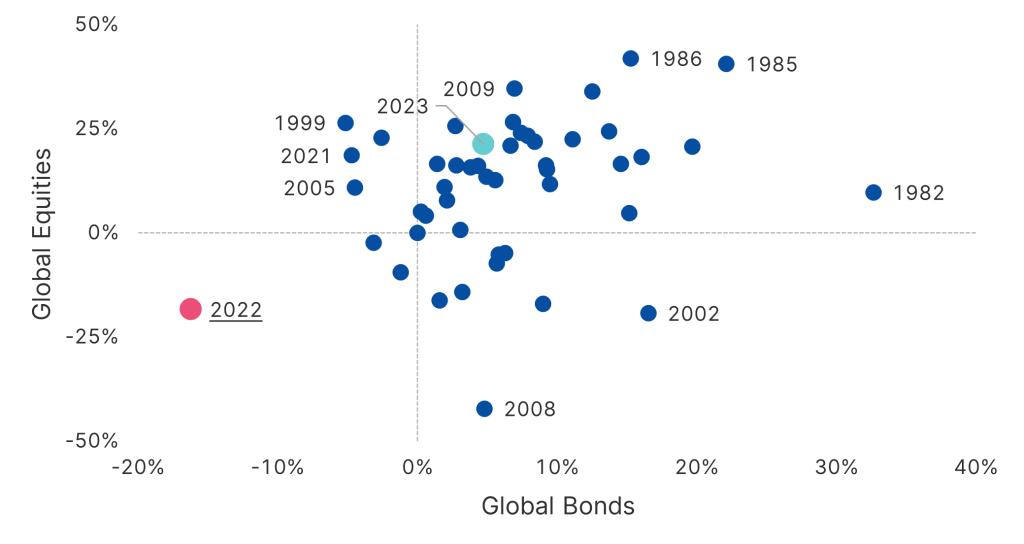
Overall, the current year is in the middle of the cloud of annual returns for equities and bonds over the past five decades, so to speak:
Historical annual returns of equities and bonds
Note: Past performance is not a reliable indicator of future performance.
Source: Bloomberg; as at 20.12.2023; Indieces: MSCI ACWI (Global Equities), Bloomberg Global Aggregate Index (Global Bonds)
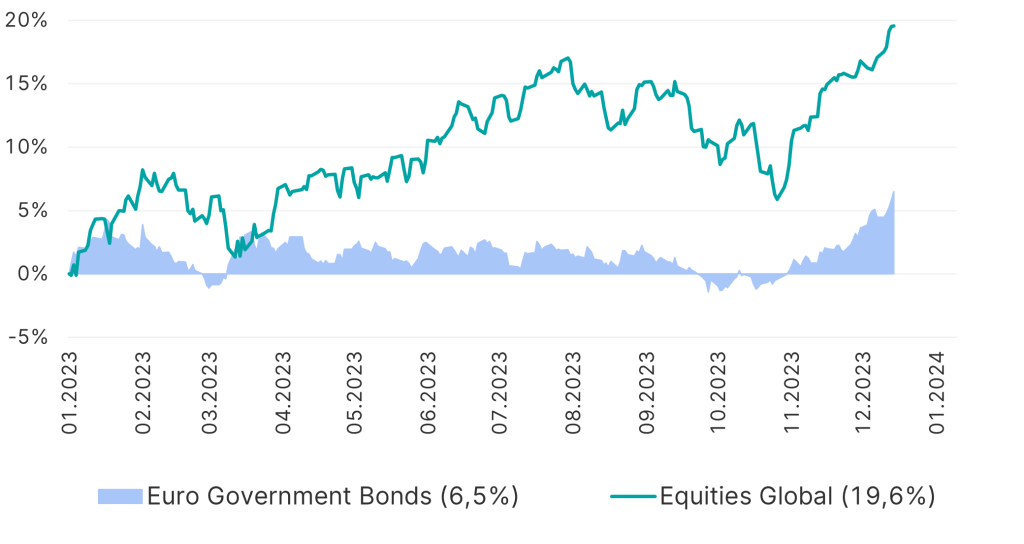
The performance of global equities and European government bonds over the course of this year is as follows
2023 Performance of European government bonds and global equities
Note: Past performance is not a reliable indicator of future performance.
Source: Bloomberg; as at 20.12.2023; Indieces: ICE BofA Euro Government Index (Euro Government Bonds), MSCI World (Equities Global)
Three phases become visible: January to the end of July, when the recession worries (USA) were gradually priced out – then until around the end of October, when the financial markets came to the conclusion that the key interest rate policy would no longer have a supportive effect in the foreseeable future – and finally until today, when the view that this supportive effect would still materialize prevailed.
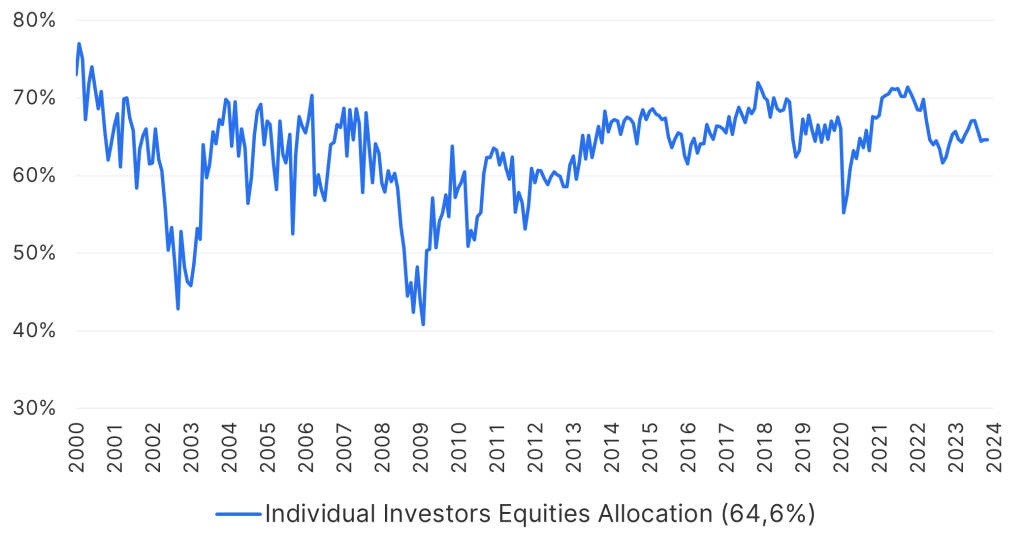
Private equity investments in Europe (with the exception of the UK) are often viewed with a certain degree of skepticism. It is worth taking a look across the “big pond”:
Portfolio share equities of private investors in the USA
Note: Past performance is not a reliable indicator of future performance.
Source: Bloomberg; as at 20.12.2023
The proportion of equities in the investments of savers in the USA fluctuates in the range of around 60%-70%, regardless of occasional crises on the stock markets. Even in 2002 and 2009, the share did not fall below 40%. The values in this chart are survey-based.
One aspect that could (again) cause increased volatility in equities in 2024 is a recession in the USA. This was already expected in 2023, but the economy proved to be extremely resilient. The reason for a recession remains unchanged: To dampen interest rate hikes with the purpose of slowing down the economy. Although 2024 is in the past, the effect of this has often been felt with a delay of 1-2 years: Primarily via the increase in the cost of financing/credit for companies.
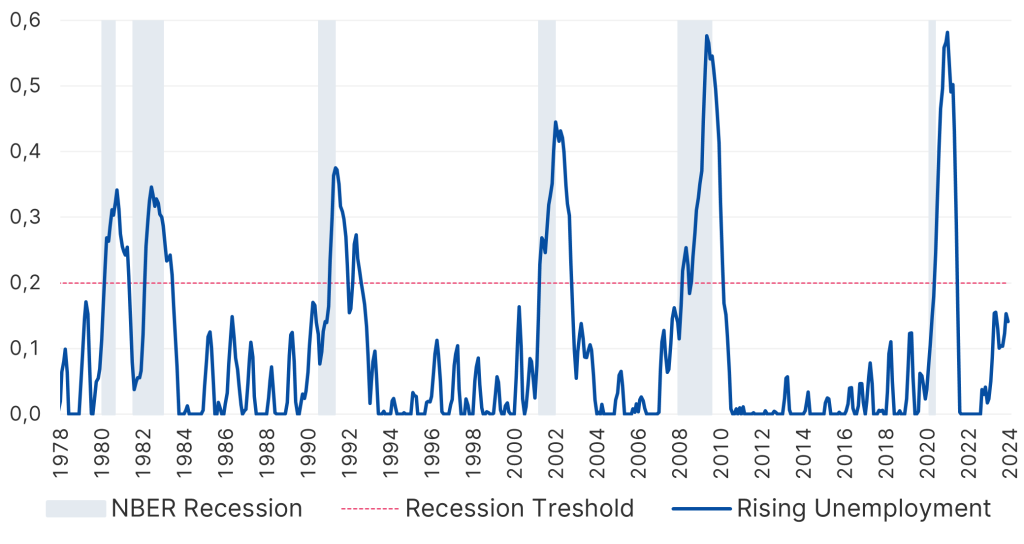
Recessions are, one might almost say, notoriously difficult to forecast or recognize in a timely manner. If recessions could be predicted with a good lead time, they would not exist at all because there would still be time to counteract them. In the past, a sudden, sharp rise in unemployment was an indicator, a signal for a recession. This is shown in the following chart:
Correlation between unemployment and recessions in the US
Note: Past performance is not a reliable indicator of future performance.
Source: Bloomberg; as at 20.12.2023
The value in the chart is based on a moving average of new unemployment. You can see that the line often rises and then falls back again – only to then “break out” sharply. The cause is an interaction between unemployment and the economy: layoffs occur (only) when the profit situation of companies has deteriorated. The number of unemployed subsequently has a negative effect on consumption, as consumption is only stable if there is no concern about jobs.
Recessions will therefore remain a concern for the time being, and the aforementioned analysis will play a role in this.
There has always been a “calendar effect” with shares. It must be remembered that this effect never occurs every year and with certainty, but on average over a long period of time (in the chart since 1999):
“Calendar effect” in global equities
Note: Past performance is not a reliable indicator of future performance.
Source: Bloomberg; as at 20.12.2023
This shows that the 4th quarter was a good one (“end-of-year rally”), and the summer is difficult (“Sell in May…”), especially September.
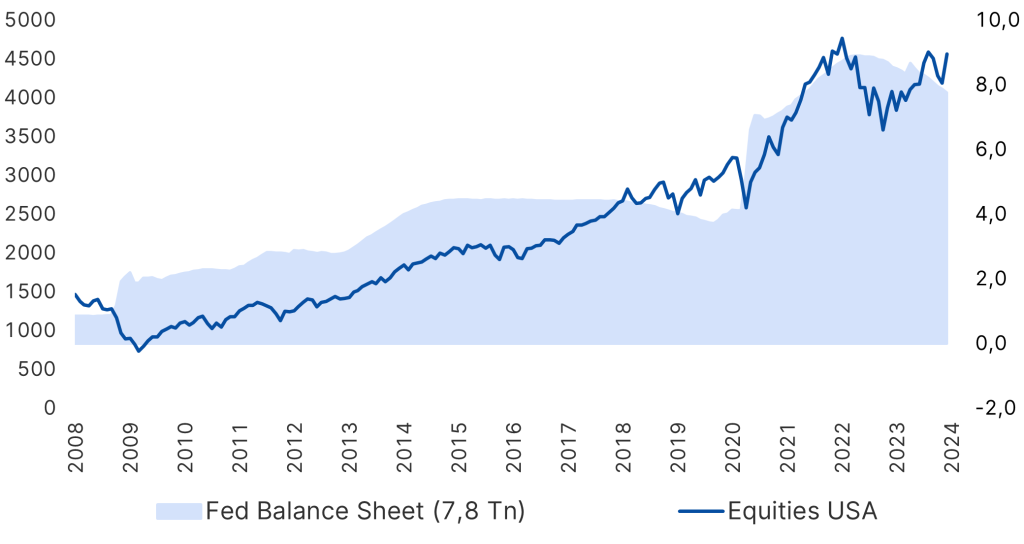
The fear that the rise in share prices in the US was and is (only) due to the support of the central bank could be dispelled. The chart shows that the strength of this correlation appears to be diminishing. A falling balance sheet total of the US Federal Reserve (as the sum of the support) meets further rising share prices:
Federal Reserve balance sheet total and US equity performance
Note: Past performance is not a reliable indicator of future performance.
Source: Bloomberg; as at 20.12.2023; Index: MSCI USA (Equities USA)
Inflation then and now
Note: Past performance is not a reliable indicator of future performance.
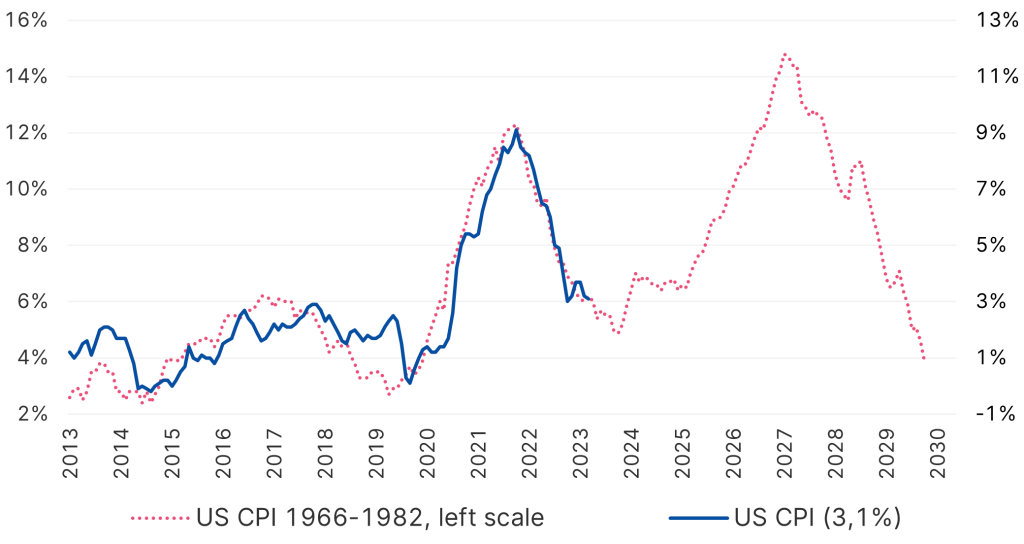
Source: Bloomberg; as at 20.12.2023
A “comeback” of inflation, as would be the case from 1977 onwards, with an even stronger rise than before, would be fatal in every respect. This shows the central banks’ balancing act between the necessary fight against inflation and a premature conclusion of the measures.
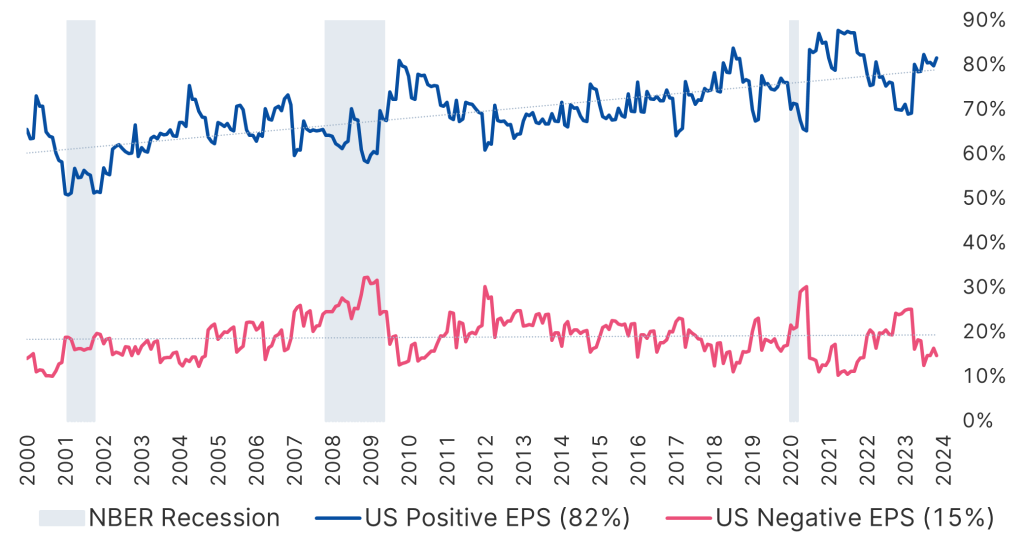
Ultimately, positive earnings surprises – in this case for US equities – are almost a fixed point:
Positive and negative earnings surprises for US equities
Note: Past performance is not a reliable indicator of future performance.
Source: Bloomberg; as at 20.12.2023
The lines are measured by the difference between the expectations of share analysts and the actual results of listed companies. This shows the innovative strength of stock corporations in their technological development and increase in productivity. This is and always will be good news for private investors.
Conclusion
2023 is shaping up to be a pleasing year for investors. It remains the case that patience is always required on the stock markets, but this patience has finally paid off. The extraordinarily high inflation of the last two years or so is over for the time being and hopefully permanently. New possibilities and opportunities will arise in 2024.
For a glossary of technical terms, please visit this link: Fund Glossary | Erste Asset Management
Legal note:
Prognoses are no reliable indicator for future performance.
Please not, that an investment in securities entails risks in addition to the opportunities described.
Legal disclaimer
This document is an advertisement. Unless indicated otherwise, source: Erste Asset Management GmbH. The language of communication of the sales offices is German and the languages of communication of the Management Company also include English.
The prospectus for UCITS funds (including any amendments) is prepared and published in accordance with the provisions of the InvFG 2011 as amended. Information for Investors pursuant to § 21 AIFMG is prepared for the alternative investment funds (AIF) administered by Erste Asset Management GmbH pursuant to the provisions of the AIFMG in conjunction with the InvFG 2011.
The currently valid versions of the prospectus, the Information for Investors pursuant to § 21 AIFMG, and the key information document can be found on the website www.erste-am.com under “Mandatory publications” and can be obtained free of charge by interested investors at the offices of the Management Company and at the offices of the depositary bank. The exact date of the most recent publication of the prospectus, the languages in which the fund prospectus or the Information for Investors pursuant to Art 21 AIFMG and the key information document are available, and any other locations where the documents can be obtained are indicated on the website www.erste-am.com. A summary of the investor rights is available in German and English on the website www.erste-am.com/investor-rights and can also be obtained from the Management Company.
The Management Company can decide to suspend the provisions it has taken for the sale of unit certificates in other countries in accordance with the regulatory requirements.
Note: You are about to purchase a product that may be difficult to understand. We recommend that you read the indicated fund documents before making an investment decision. In addition to the locations listed above, you can obtain these documents free of charge at the offices of the referring Sparkassen bank and the offices of Erste Bank der oesterreichischen Sparkassen AG. You can also access these documents electronically at www.erste-am.com.
Our analyses and conclusions are general in nature and do not take into account the individual characteristics of our investors in terms of earnings, taxation, experience and knowledge, investment objective, financial position, capacity for loss, and risk tolerance. Past performance is not a reliable indicator of the future performance of a fund.
Please note: Investments in securities entail risks in addition to the opportunities presented here. The value of units and their earnings can rise and fall. Changes in exchange rates can also have a positive or negative effect on the value of an investment. For this reason, you may receive less than your originally invested amount when you redeem your units. Persons who are interested in purchasing units in investment funds are advised to read the current fund prospectus(es) and the Information for Investors pursuant to § 21 AIFMG, especially the risk notices they contain, before making an investment decision. If the fund currency is different than the investor’s home currency, changes in the relevant exchange rate can positively or negatively influence the value of the investment and the amount of the costs associated with the fund in the home currency.
We are not permitted to directly or indirectly offer, sell, transfer, or deliver this financial product to natural or legal persons whose place of residence or domicile is located in a country where this is legally prohibited. In this case, we may not provide any product information, either.
Please consult the corresponding information in the fund prospectus and the Information for Investors pursuant to § 21 AIFMG for restrictions on the sale of the fund to American or Russian citizens.
It is expressly noted that this communication does not provide any investment recommendations, but only expresses our current market assessment. Thus, this communication is not a substitute for investment advice.
This document does not represent a sales activity of the Management Company and therefore may not be construed as an offer for the purchase or sale of financial or investment instruments.
Erste Asset Management GmbH is affiliated with the Erste Bank and austrian Sparkassen banks.
Please also read the “Information about us and our securities services” published by your bank.
More on the topic

China prepares economic stimulus package in response to recession and looming trade war
The former growth engine China is having trouble getting back on track. Geopolitical tensions, the crisis in the domestic real estate sector and weak domestic consumption are hampering the country’s economy.
The government in Beijing is using billions in support measures not only to counter the economic downturn, but also to brace itself against the tariffs announced by US President-elect Donald Trump. But can these measures also help the faltering Chinese stock market?