
A few months have passed since our look into the world of charts. As the following chart comparing annual equity and bond returns illustrates, the year 2022 closed in an extraordinary fashion. The fact that these asset classes, which regularly take different performance paths and thus ensure diversification in a portfolio, simultaneously produced a double-digit negative result in the same calendar year is unique in the period covered by the chart.
Global equities and bonds
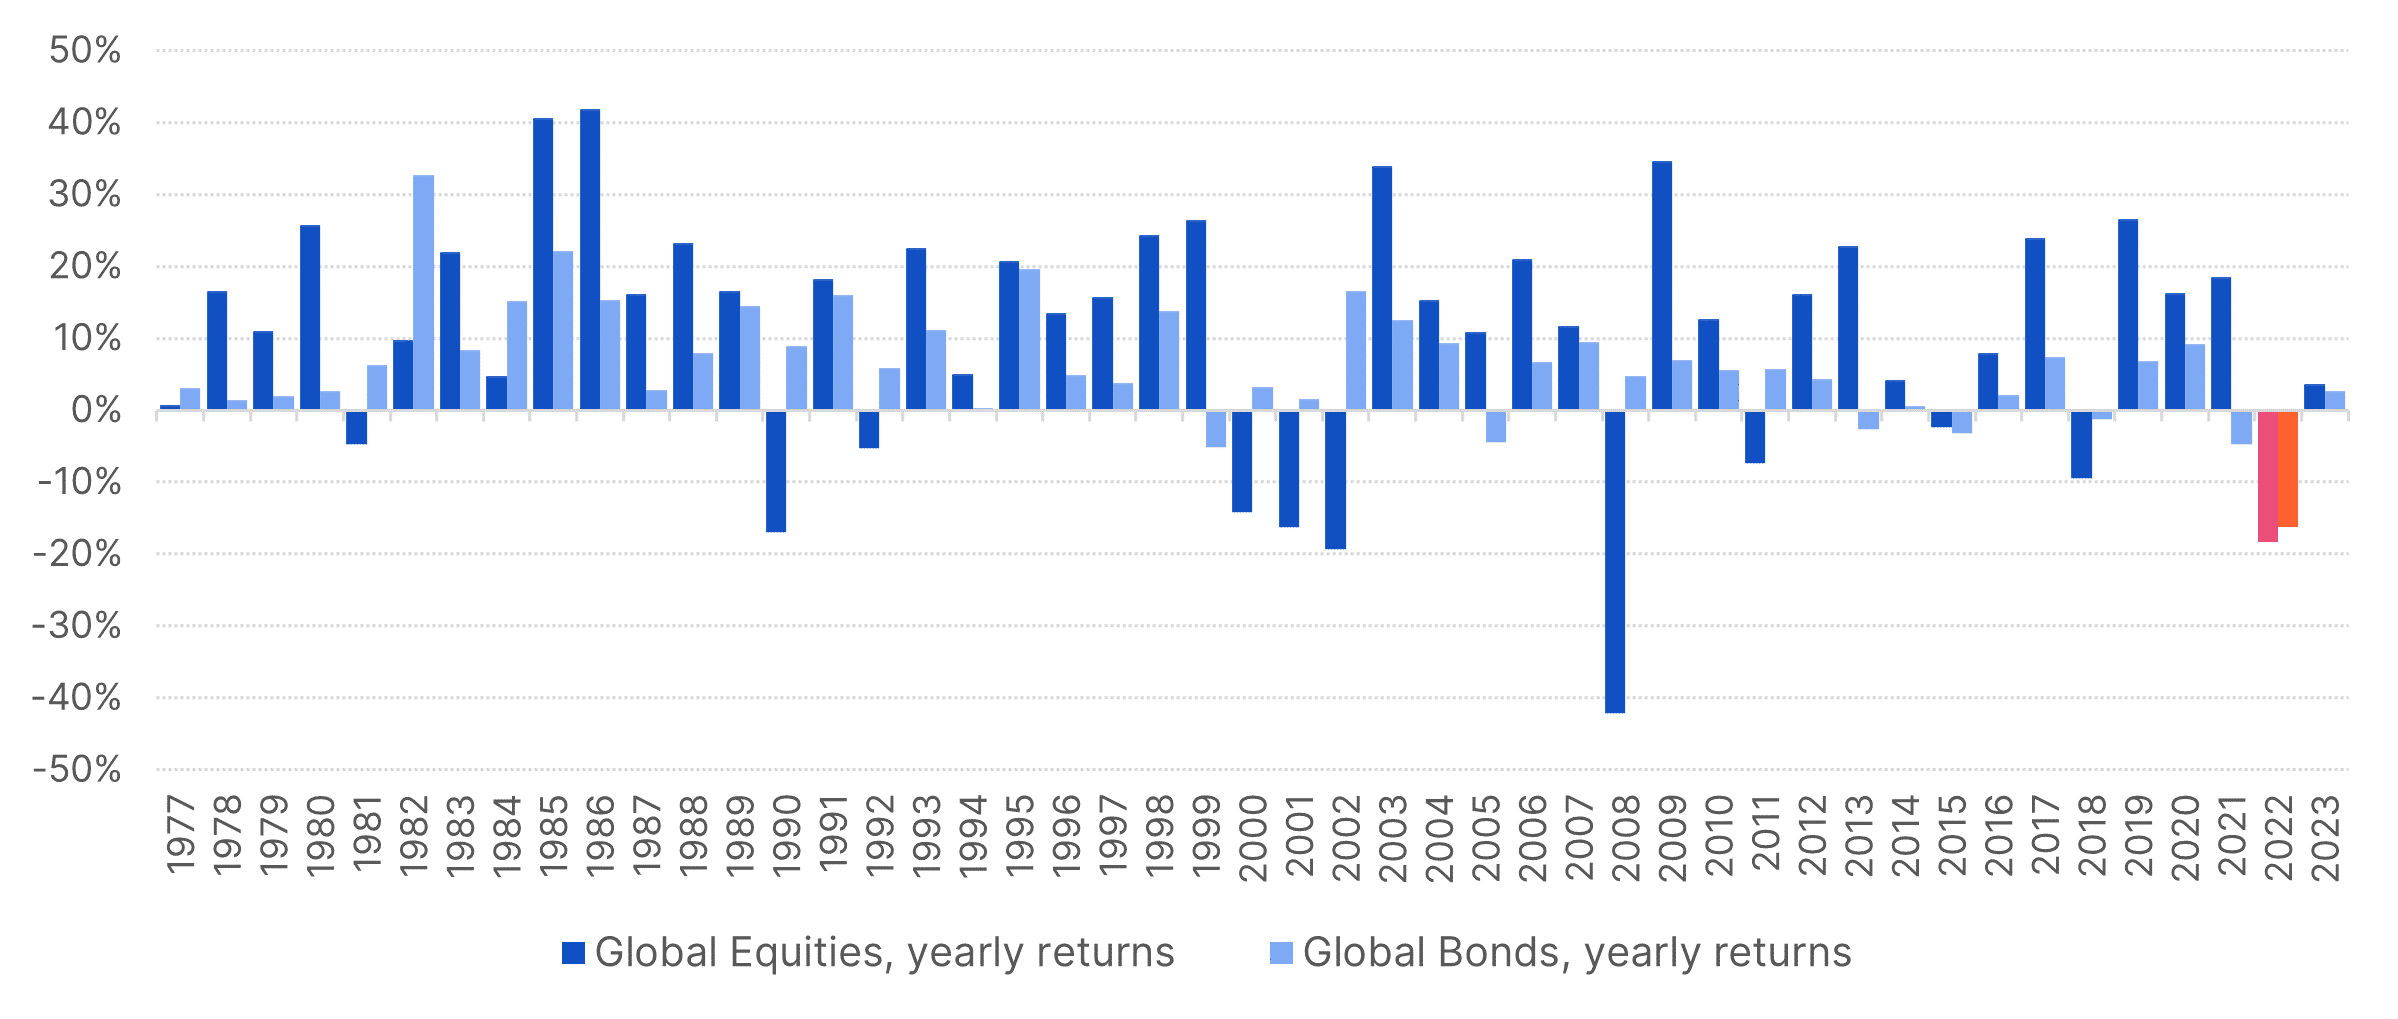
Note: Past performance is not a reliable indicator of future performance of an investment.
Last year’s convergence of unexpectedly high inflation, the economic fallout from the pandemic (a congestion of global supply chains due to high demand for goods, especially online, on the one hand; and partial loss of production on the other), massively increased energy and commodity prices, and finally Russia’s war of aggression in Ukraine not only weighed on investor sentiment, but also prompted international central banks to fight inflation through rapid, continued interest rate hikes, regardless of whether this might have come at the expense of economic development. After all, interest rate hikes act as a powerful brake, in this case on the demand side of the economy. In the wake of this scenario, fears of what might happen now have shifted from rapid inflation to the possibility of a recession, i.e. an economic crisis, especially in the US.
At the same time, global economic indicators have remained comparatively good for now. Low unemployment figures and consumers with a relatively stable propensity to consume paint a robust picture. This good news is at the same time bad news, as it is what seems to have led the US Federal Reserve in particular, as central bank of the world’s leading equity market, to tighten the interest rate screws more than had been expected.
The occasional “inversion” of the US yield curve provides an interesting manifestation of this inconsistent situation. This yield curve is a graphical representation of interest rates for different maturities. Normally, an investment with a longer time to maturity offers a higher return than a shorter investment, since a riskier investment “in the future” should be more profitable. The fact that an investment for a shorter period offers a higher rate of return – as is the case with an inversion of the yield curve – indicates that the nearer future is subject to more significant uncertainty. Two variants of the model are common (the difference between 2Y and 10Y government bond yields, and between 3M and 10Y bond yields), but they convey the same message. As of March 2023, this reversal is more pronounced than ever before:
Reversal of the US yield curve
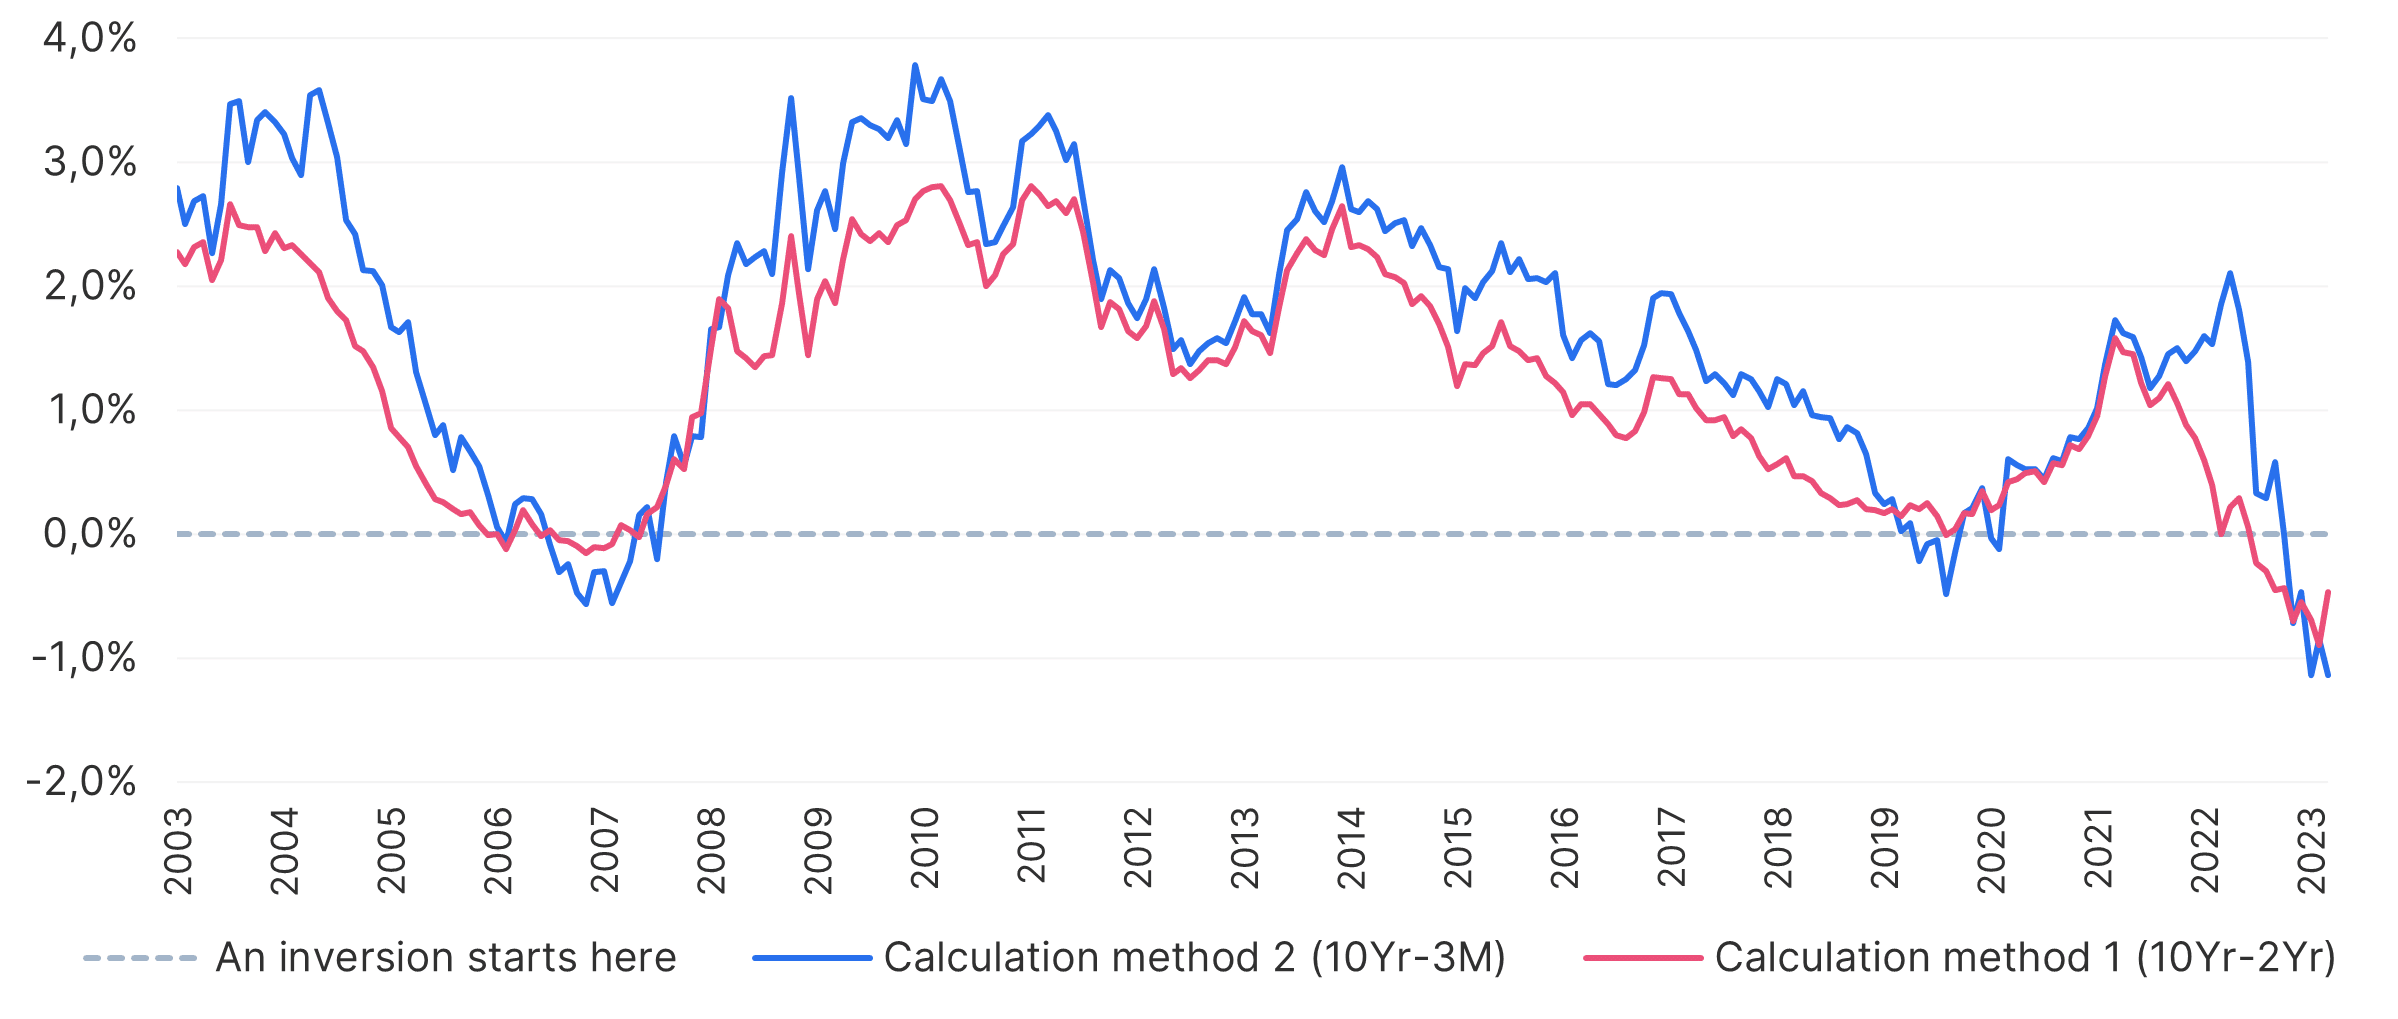
Note: Past performance is not a reliable indicator of future performance of an investment.
In the past, such a reversal would often herald a recession. This may happen again now – even if the fear of recession has been around for some time without materialising. However, a foolproof recession signal is impossible. The reversal can also be an expression of the fact that the central banks are raising interest rates at the short end unexpectedly quickly and the long end (i.e. for example 10Y bonds) cannot keep up with this development.
Europe has been facing a special situation: natural gas prices – a very important energy source in the past, especially for Germany and Austria – have risen enormously. At its peak in August 2022, the price had increased by an unbelievable 1,500% from the beginning of 2021, as the following chart illustrates. At the same time, it is obvious that the USA, which produces a large part of its own natural gas, was not exposed to this high-speed trajectory to nearly the same extent.
Natural gas prices in Europe and the USA
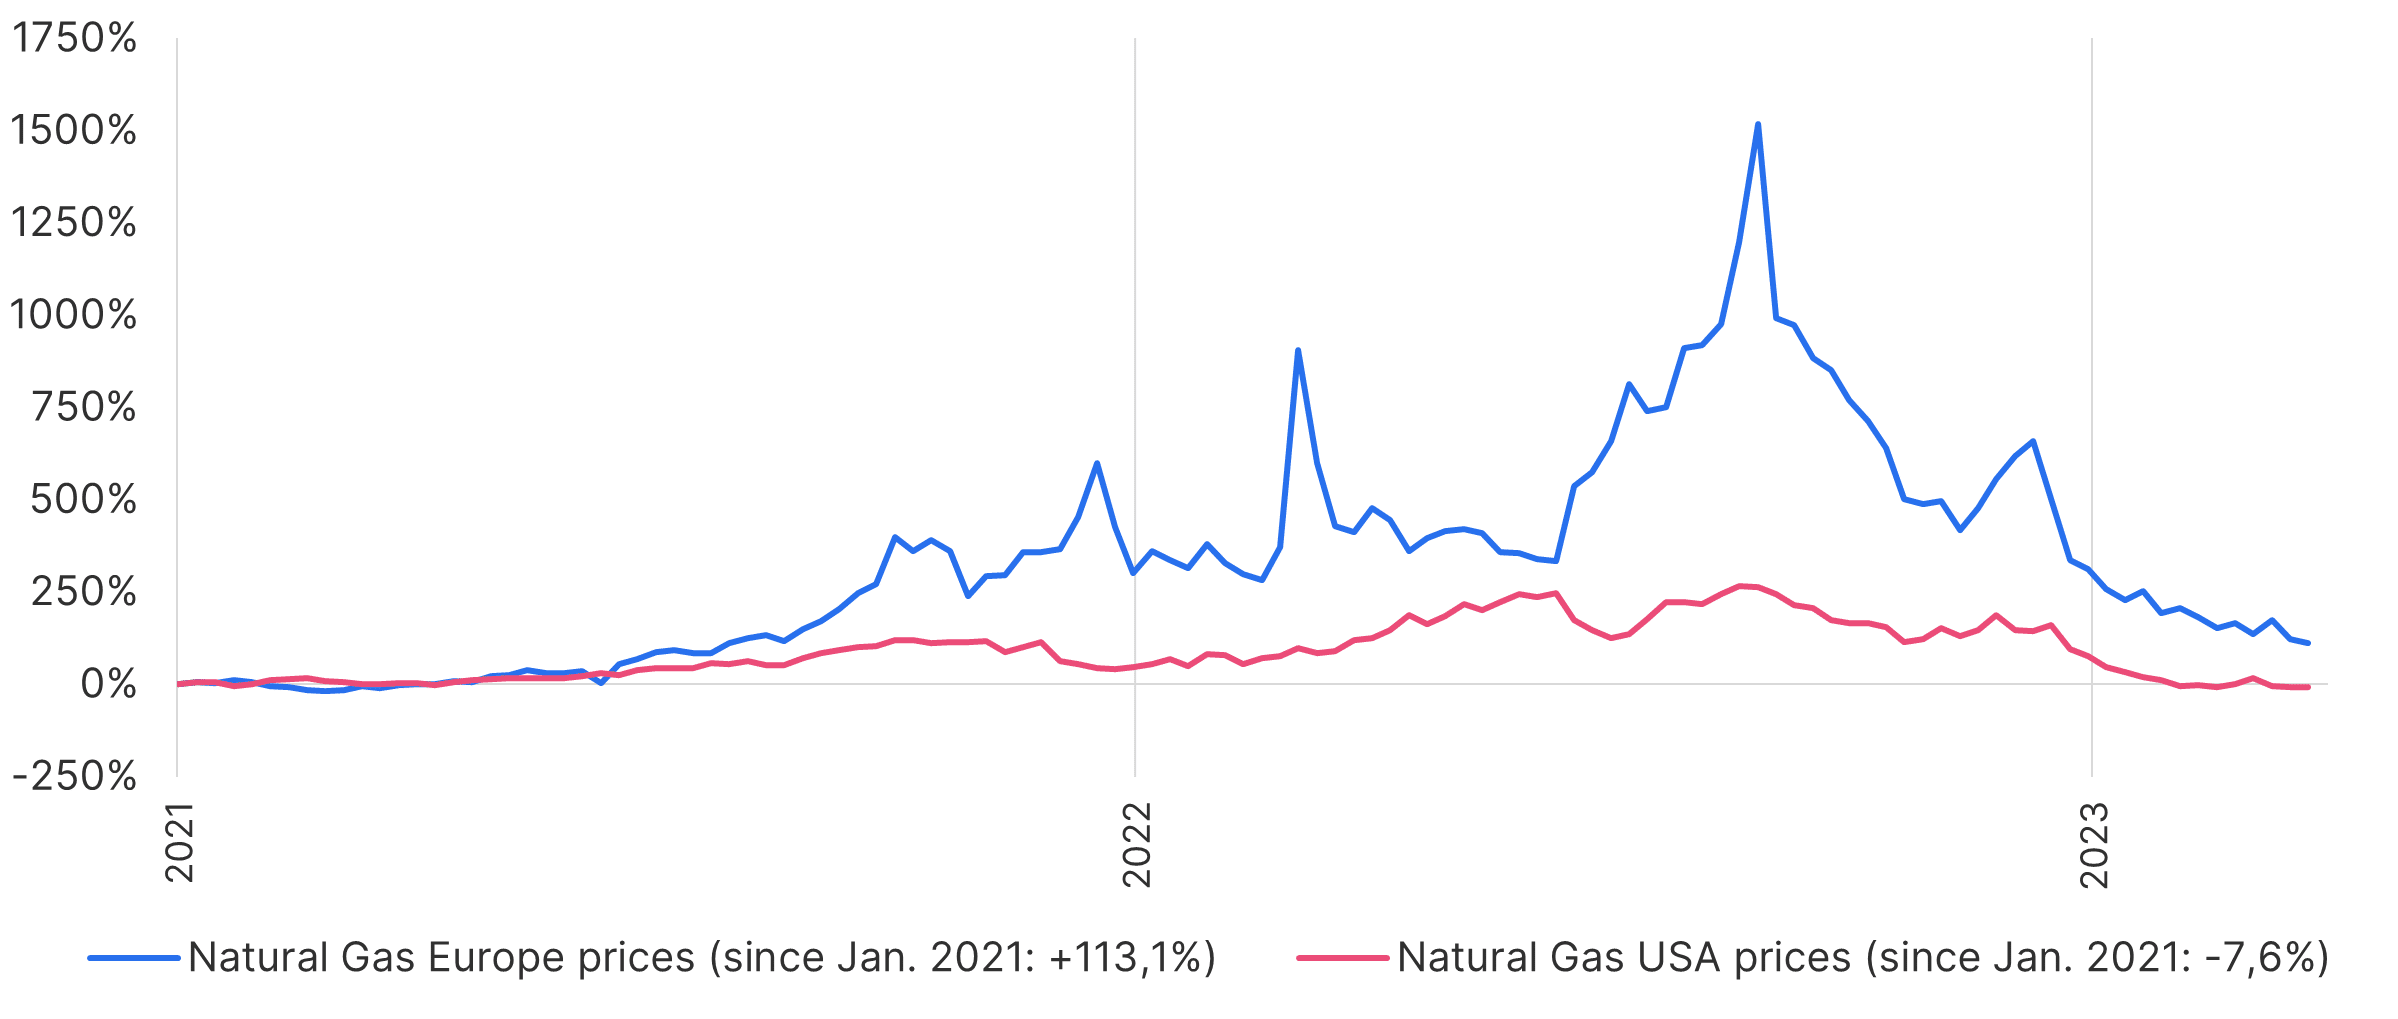
Note: Past performance is not a reliable indicator of future performance of an investment.
The mild winter provided Europe with a lifeline – in Austria, the temperatures in 2022/23 were rarely below zero for extensive periods of time. This has led to the situation where today, at a time when winter already seems to be coming to an end, the stock level is still almost 60%. Such a value was would have been a rare occurrence in the past, as the following chart shows:
Natural gas stocks in Europe
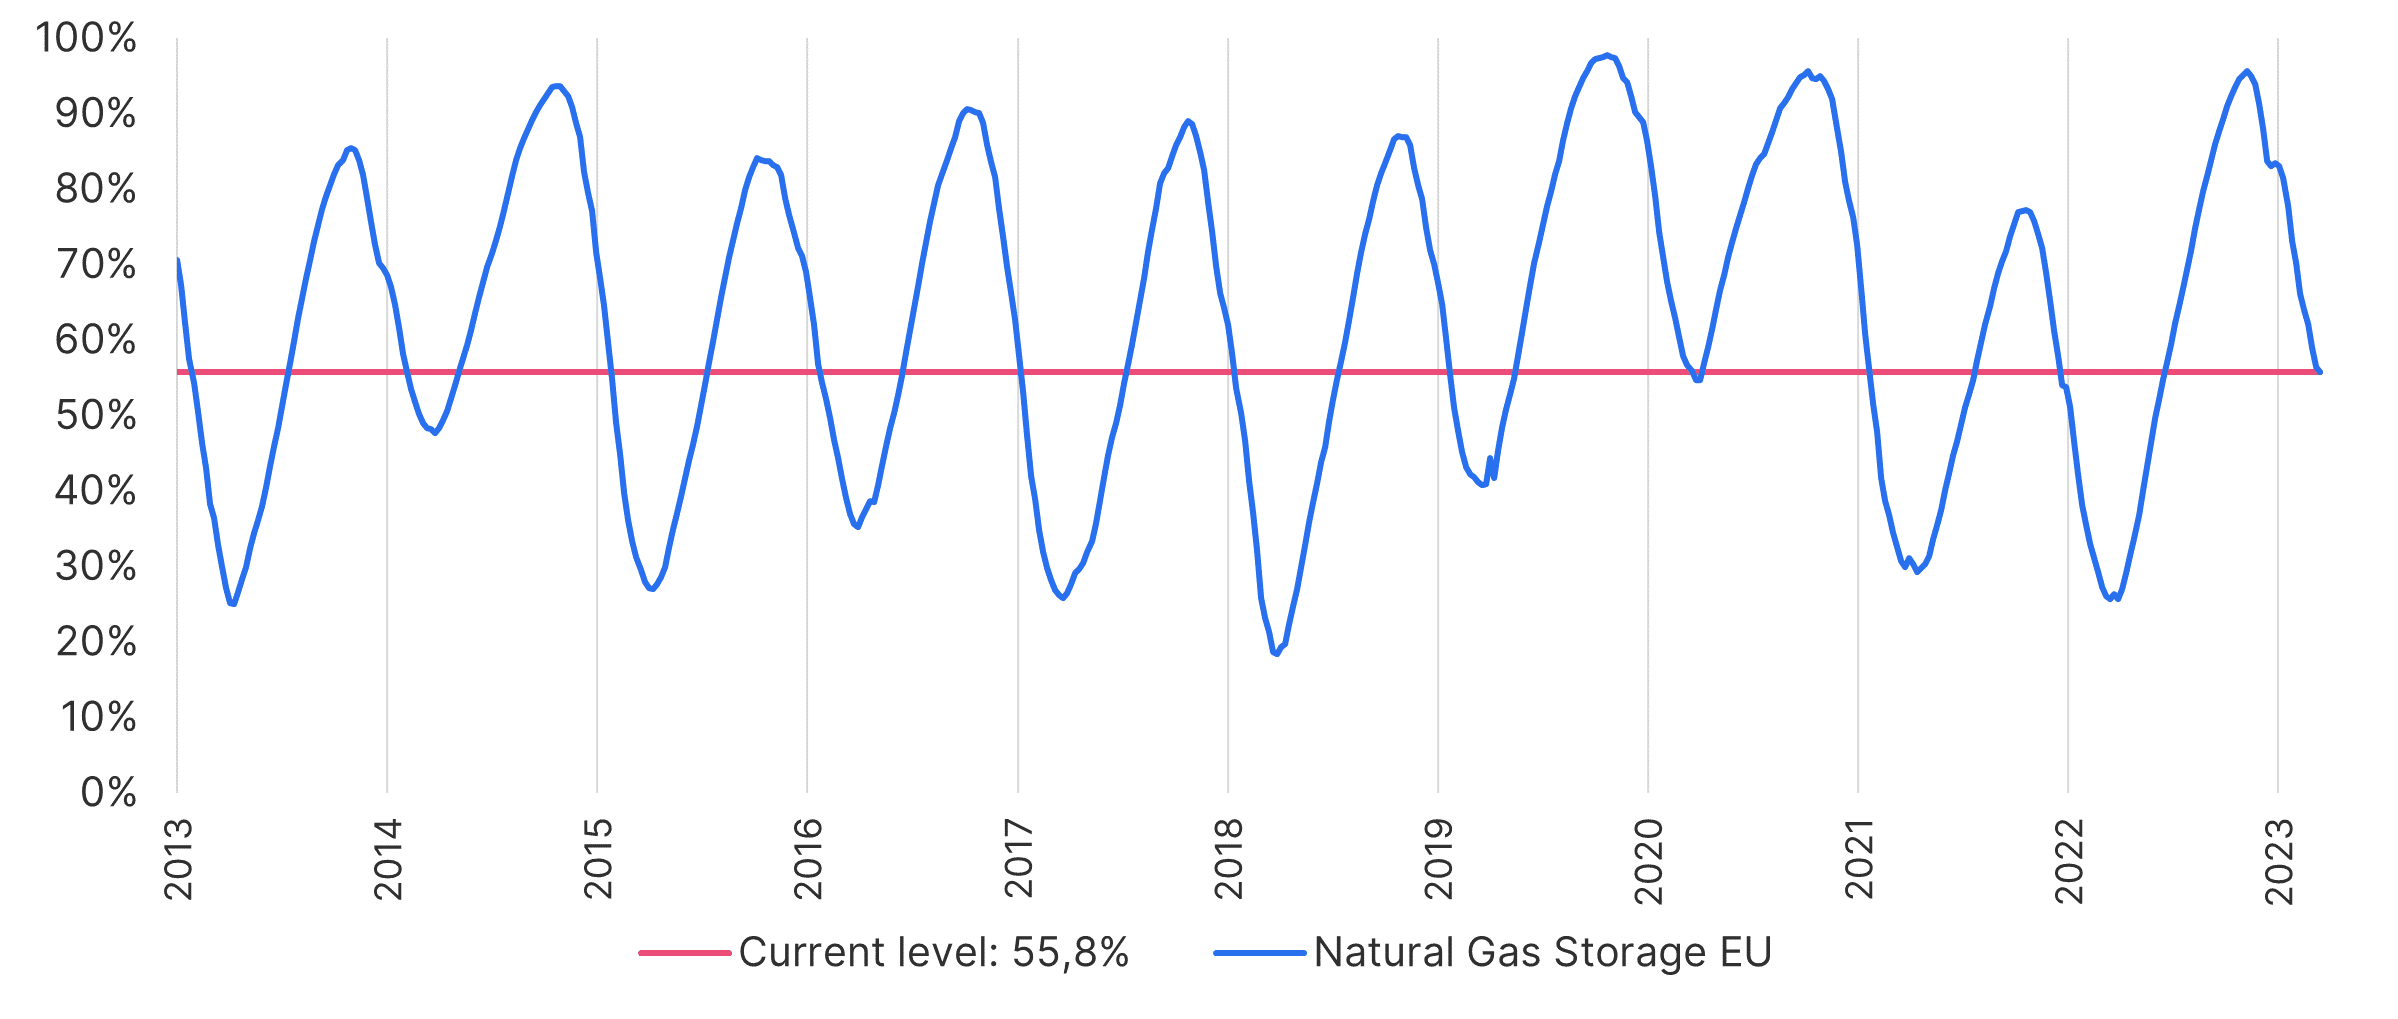
Note: Past performance is not a reliable indicator of future performance of an investment.
Europe has been able to compensate for the lack of natural gas supplies from Russia with additional imports, especially from Norway and Algeria, as well as by purchasing liquefied natural gas (LNG) from the Gulf region, which is transported by ship and does not require pipelines. The necessary infrastructure (terminals to pump the LNG) was and is being built very quickly.
Energy prices
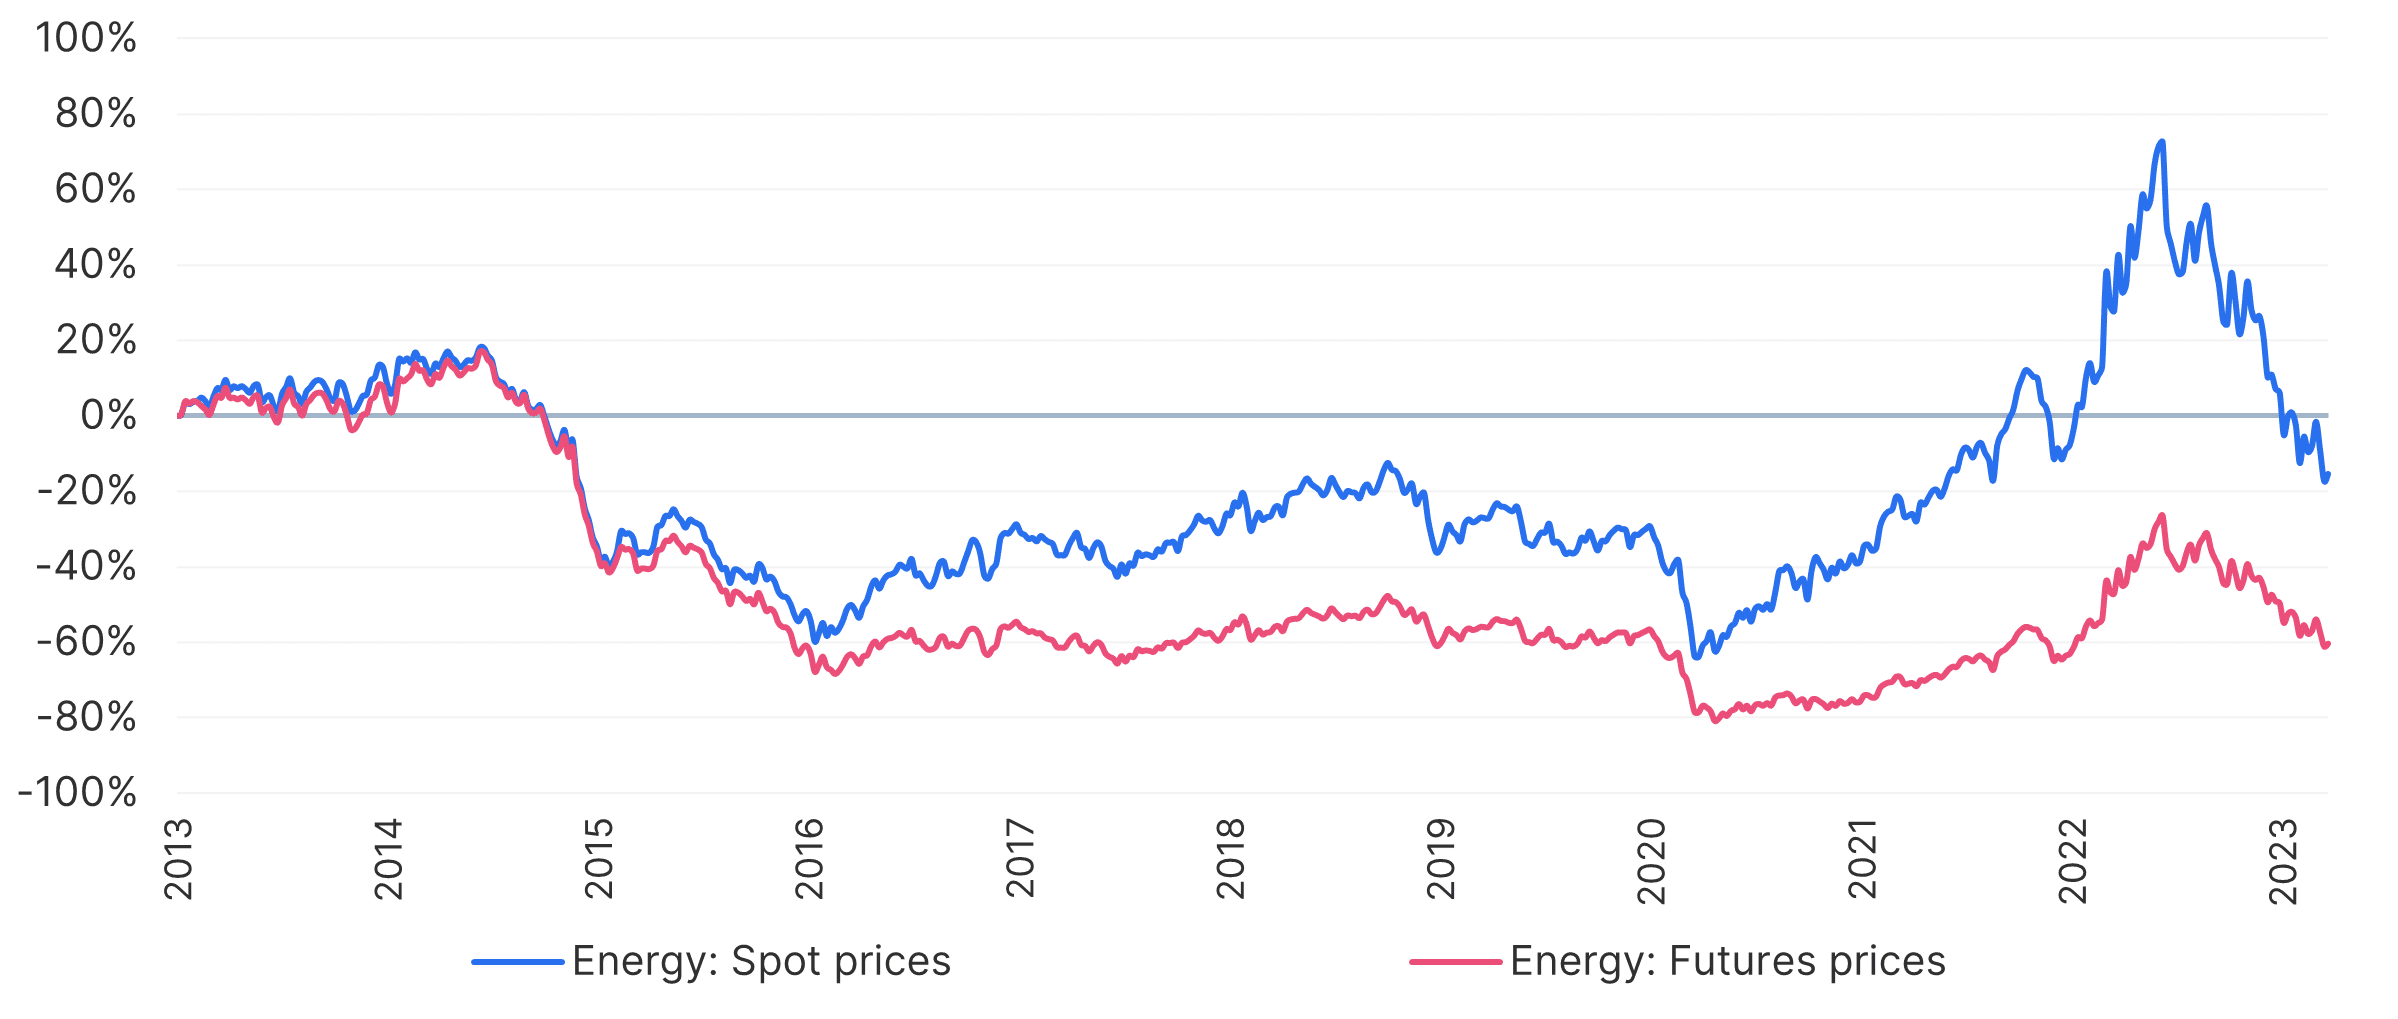
Note: Past performance is not a reliable indicator of future performance of an investment.
Interestingly, energy prices (primarily oil and natural gas) – when viewed over a longer period of time – have not taken the same dramatic course as the one we have seen over the last two to three years. Over a period of ten years the ups and downs are roughly balanced, as the chart illustrates. This is based on the so-called spot prices, which are relevant for all those who process energy (or commodities in general). The futures prices, which are also shown, are important for financial investors who may want to participate in the price performance but cannot store or process raw materials.
The rapid interest rate hikes by central banks (USA, European Union, UK, etc.), which are not always accurately forecast by the financial markets, have shaken up the bond markets, which are directly linked to interest rates. The following chart shows the so-called volatility (i.e. the range of fluctuation) of shares and bonds, respectively:
Volatility of equities and bonds
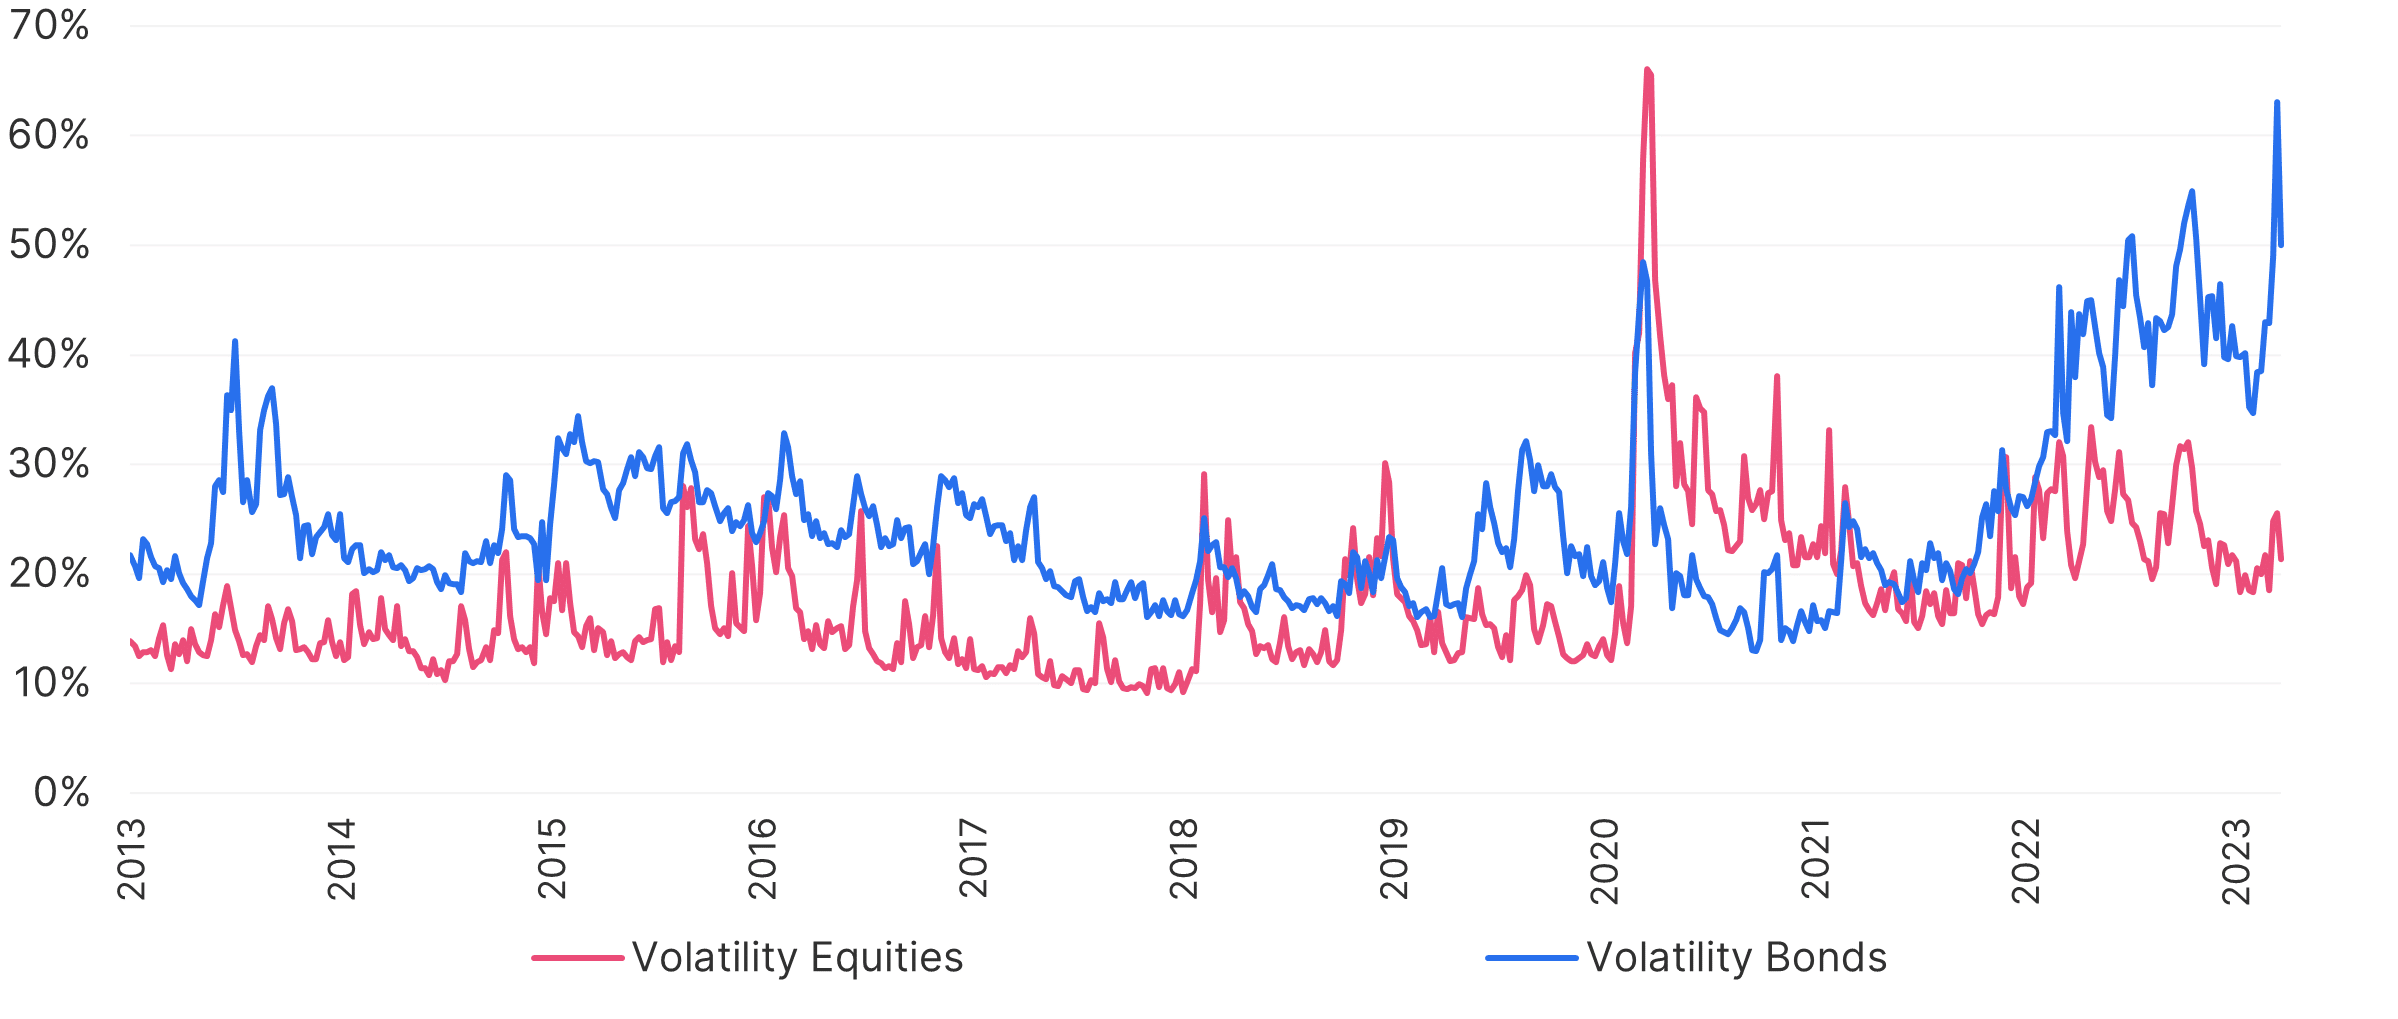
Note: Past performance is not a reliable indicator of future performance of an investment.
In the year to date, the bond volatility (especially of government bonds) has noticeably decoupled from the volatility of equities. This reflects the fact that during this period, uncertainty was much higher for bonds than for equities, whose trajectory has been negative, but where there was no distortion or panic at any point, such as for example in 2020, at the height of the Covid pandemic.
Another economic spillover from the pandemic manifests itself in the so-called Beveridge curve (named after the British economist W. H. Beveridge), which establishes a correlation between job vacancies and unemployment in a country:
Beveridge Curve USA
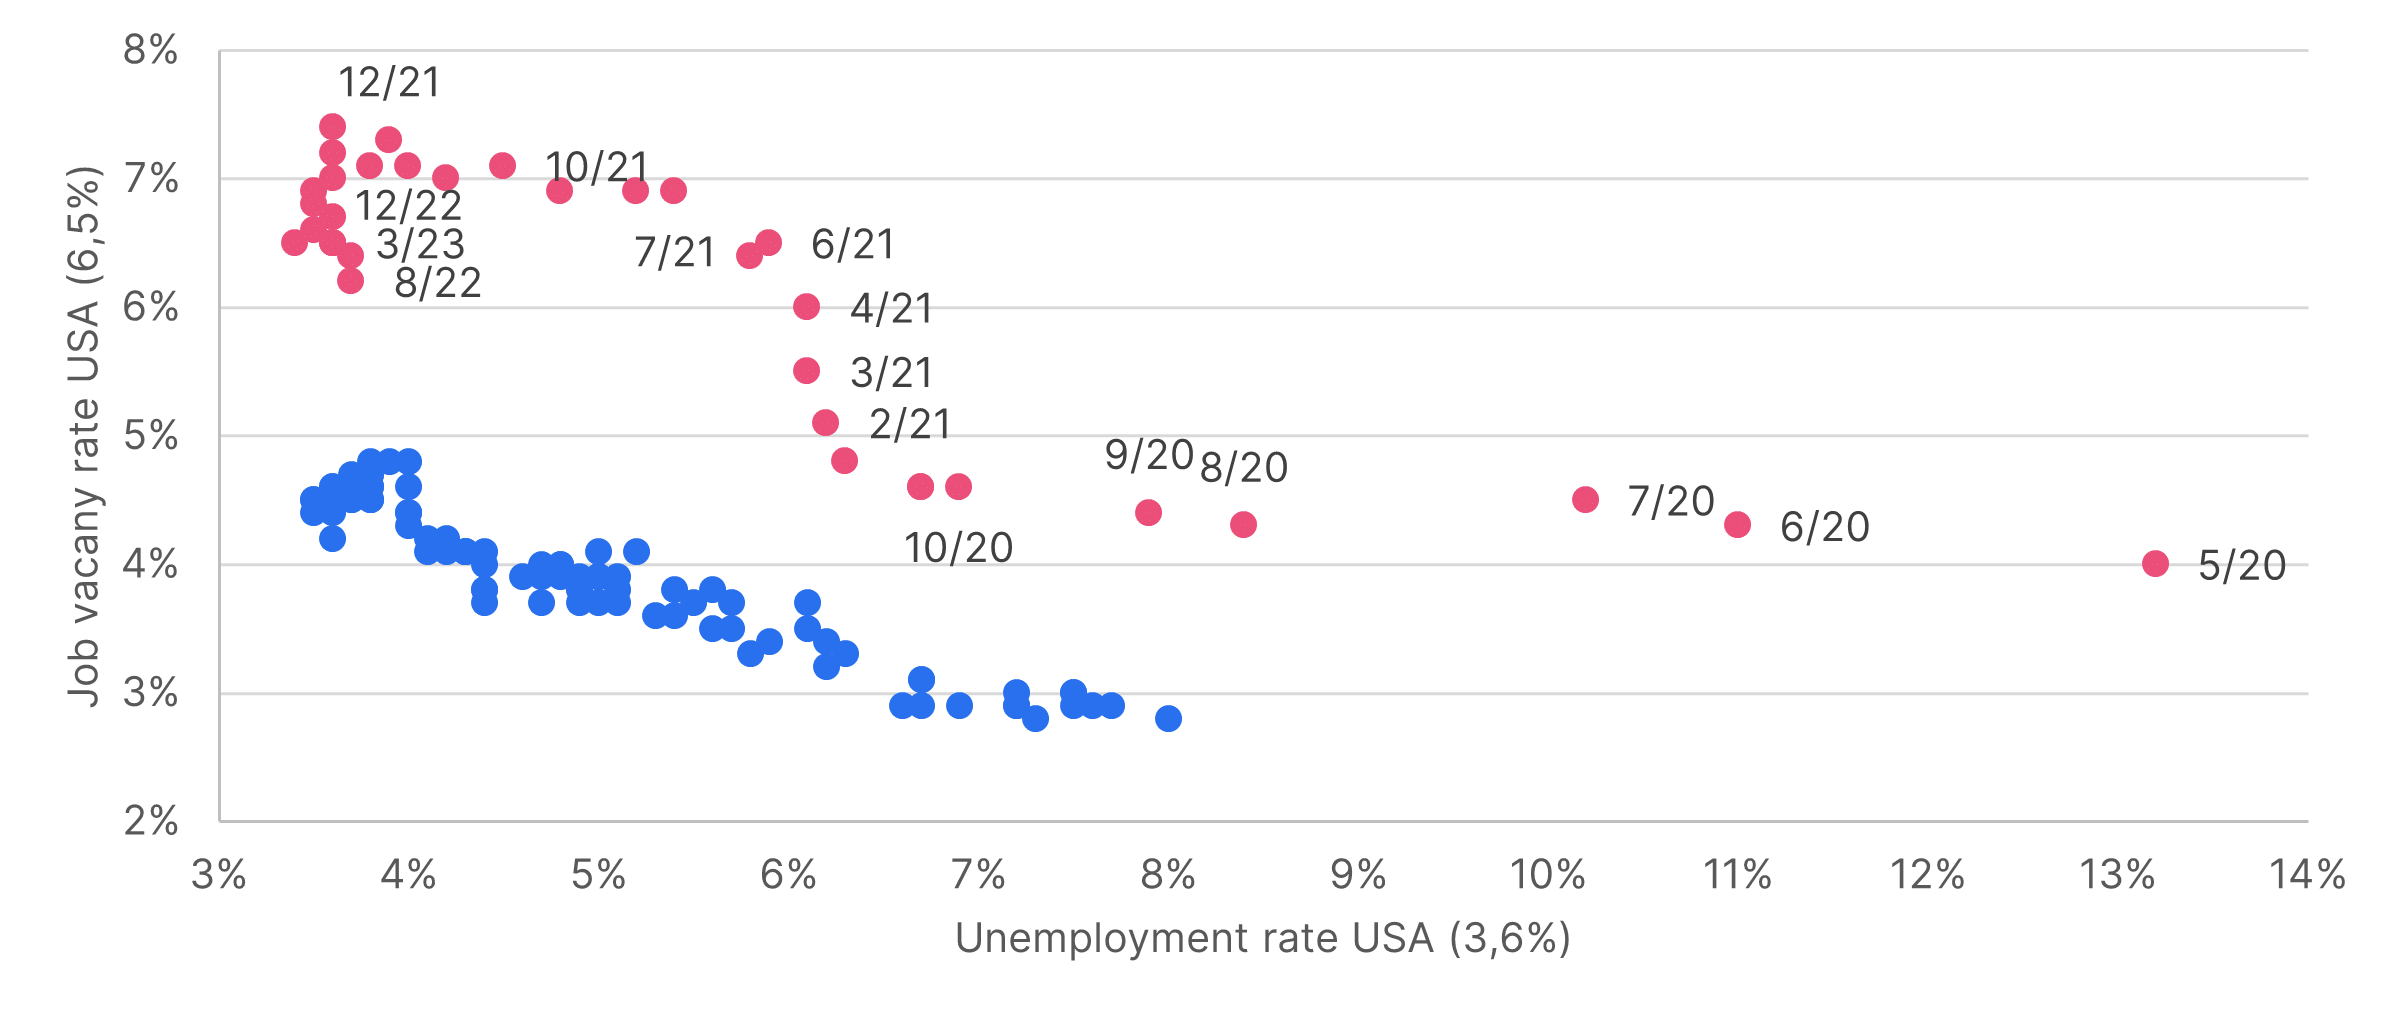
Note: Past performance is not a reliable indicator of future performance of an investment.
The points marked in red are all in the period from May 2020 to March 2023, and are thus directly or indirectly related to the Covid pandemic. They highlight the fact that the situation in the US labour market has changed since the pandemic. One driver of this trend was the unusually significant reduction in the number of participants in the labour market, because a considerable portion of people did not start looking for work again after the end of the pandemic. This is not necessarily an expression of resignation, but of a self-determined “early retirement”.
The Beveridge curve has thus shifted upwards, indicating that the labour market in the US has now become less efficient at filling vacancies, and at the same time that unemployment, most recently at 3.6%, is very low. This is positive in principle, of course, but it makes it more difficult for the US economy to return to equilibrium. That, in itself, is a factor for increased inflation. In a best-case scenario, more people in the US will participate in the labour market again in the future in order to solve the bottleneck that has been created.
Finally, it is always worthwhile to look at performance over a long-term period. Investing in equities will always come with temporary setbacks, but for the long term the profitability and utility are indisputable:
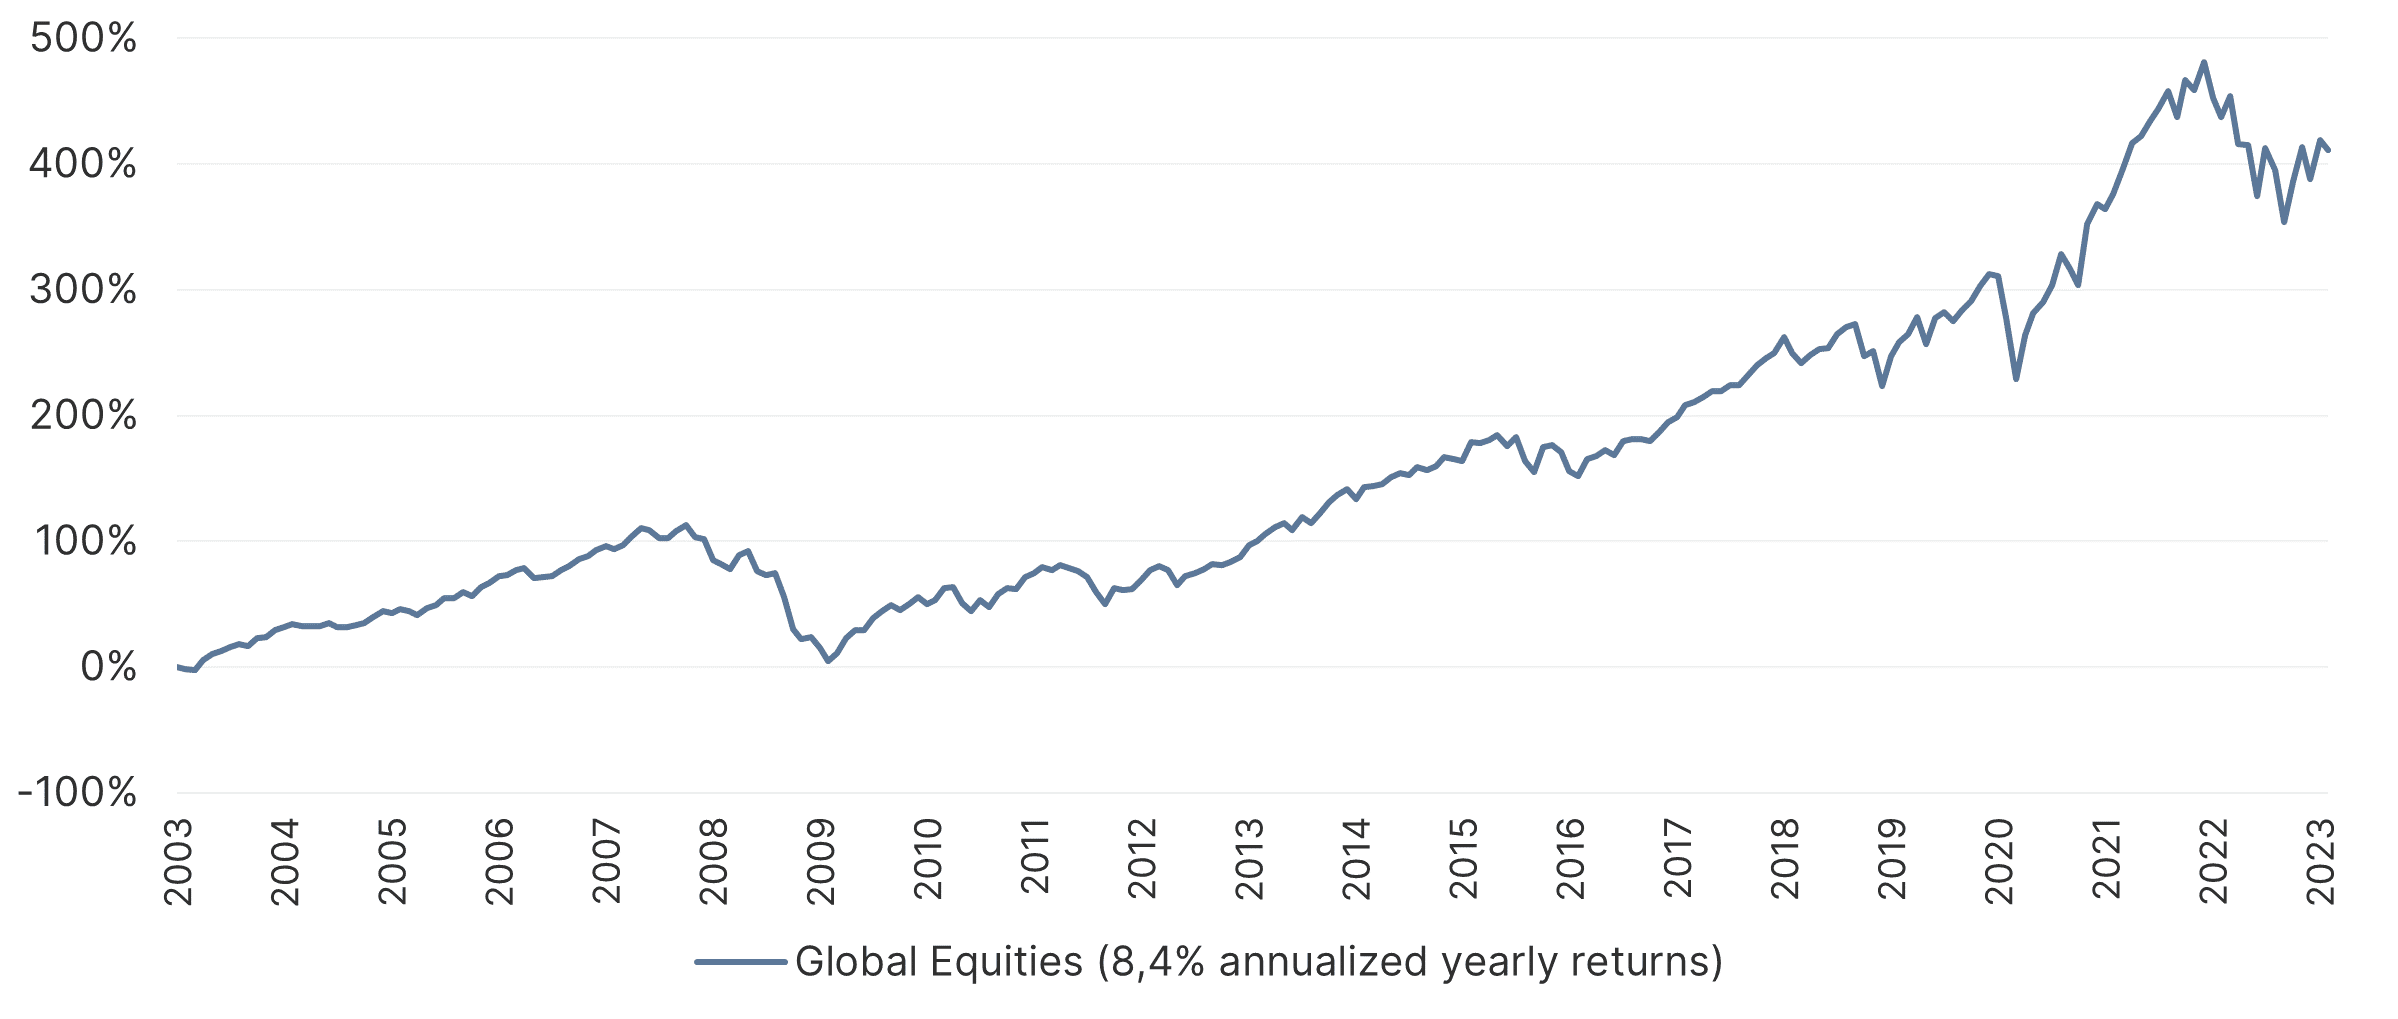
Note: Past performance is not a reliable indicator of future performance of an investment.
Over a 20Y period, equities, as measured on the basis of a global index before management costs, return a substantial 8% per year (i.e. annualised), which provides a solid basis for personal wealth accumulation.
Conclusion
The interplay of inflation on an extraordinary scale, central bank measures that cannot always be clearly assessed and a potential recession in the USA continues to occupy the equity markets. This is reflected in popular financial charts.
For a glossary of technical terms, please visit this link: Fund Glossary | Erste Asset Management
Legal note:
Prognoses are no reliable indicator for future performance.
Legal disclaimer
This document is an advertisement. Unless indicated otherwise, source: Erste Asset Management GmbH. The language of communication of the sales offices is German and the languages of communication of the Management Company also include English.
The prospectus for UCITS funds (including any amendments) is prepared and published in accordance with the provisions of the InvFG 2011 as amended. Information for Investors pursuant to § 21 AIFMG is prepared for the alternative investment funds (AIF) administered by Erste Asset Management GmbH pursuant to the provisions of the AIFMG in conjunction with the InvFG 2011.
The currently valid versions of the prospectus, the Information for Investors pursuant to § 21 AIFMG, and the key information document can be found on the website www.erste-am.com under “Mandatory publications” and can be obtained free of charge by interested investors at the offices of the Management Company and at the offices of the depositary bank. The exact date of the most recent publication of the prospectus, the languages in which the fund prospectus or the Information for Investors pursuant to Art 21 AIFMG and the key information document are available, and any other locations where the documents can be obtained are indicated on the website www.erste-am.com. A summary of the investor rights is available in German and English on the website www.erste-am.com/investor-rights and can also be obtained from the Management Company.
The Management Company can decide to suspend the provisions it has taken for the sale of unit certificates in other countries in accordance with the regulatory requirements.
Note: You are about to purchase a product that may be difficult to understand. We recommend that you read the indicated fund documents before making an investment decision. In addition to the locations listed above, you can obtain these documents free of charge at the offices of the referring Sparkassen bank and the offices of Erste Bank der oesterreichischen Sparkassen AG. You can also access these documents electronically at www.erste-am.com.
Our analyses and conclusions are general in nature and do not take into account the individual characteristics of our investors in terms of earnings, taxation, experience and knowledge, investment objective, financial position, capacity for loss, and risk tolerance. Past performance is not a reliable indicator of the future performance of a fund.
Please note: Investments in securities entail risks in addition to the opportunities presented here. The value of units and their earnings can rise and fall. Changes in exchange rates can also have a positive or negative effect on the value of an investment. For this reason, you may receive less than your originally invested amount when you redeem your units. Persons who are interested in purchasing units in investment funds are advised to read the current fund prospectus(es) and the Information for Investors pursuant to § 21 AIFMG, especially the risk notices they contain, before making an investment decision. If the fund currency is different than the investor’s home currency, changes in the relevant exchange rate can positively or negatively influence the value of the investment and the amount of the costs associated with the fund in the home currency.
We are not permitted to directly or indirectly offer, sell, transfer, or deliver this financial product to natural or legal persons whose place of residence or domicile is located in a country where this is legally prohibited. In this case, we may not provide any product information, either.
Please consult the corresponding information in the fund prospectus and the Information for Investors pursuant to § 21 AIFMG for restrictions on the sale of the fund to American or Russian citizens.
It is expressly noted that this communication does not provide any investment recommendations, but only expresses our current market assessment. Thus, this communication is not a substitute for investment advice.
This document does not represent a sales activity of the Management Company and therefore may not be construed as an offer for the purchase or sale of financial or investment instruments.
Erste Asset Management GmbH is affiliated with the Erste Bank and austrian Sparkassen banks.
Please also read the “Information about us and our securities services” published by your bank.