
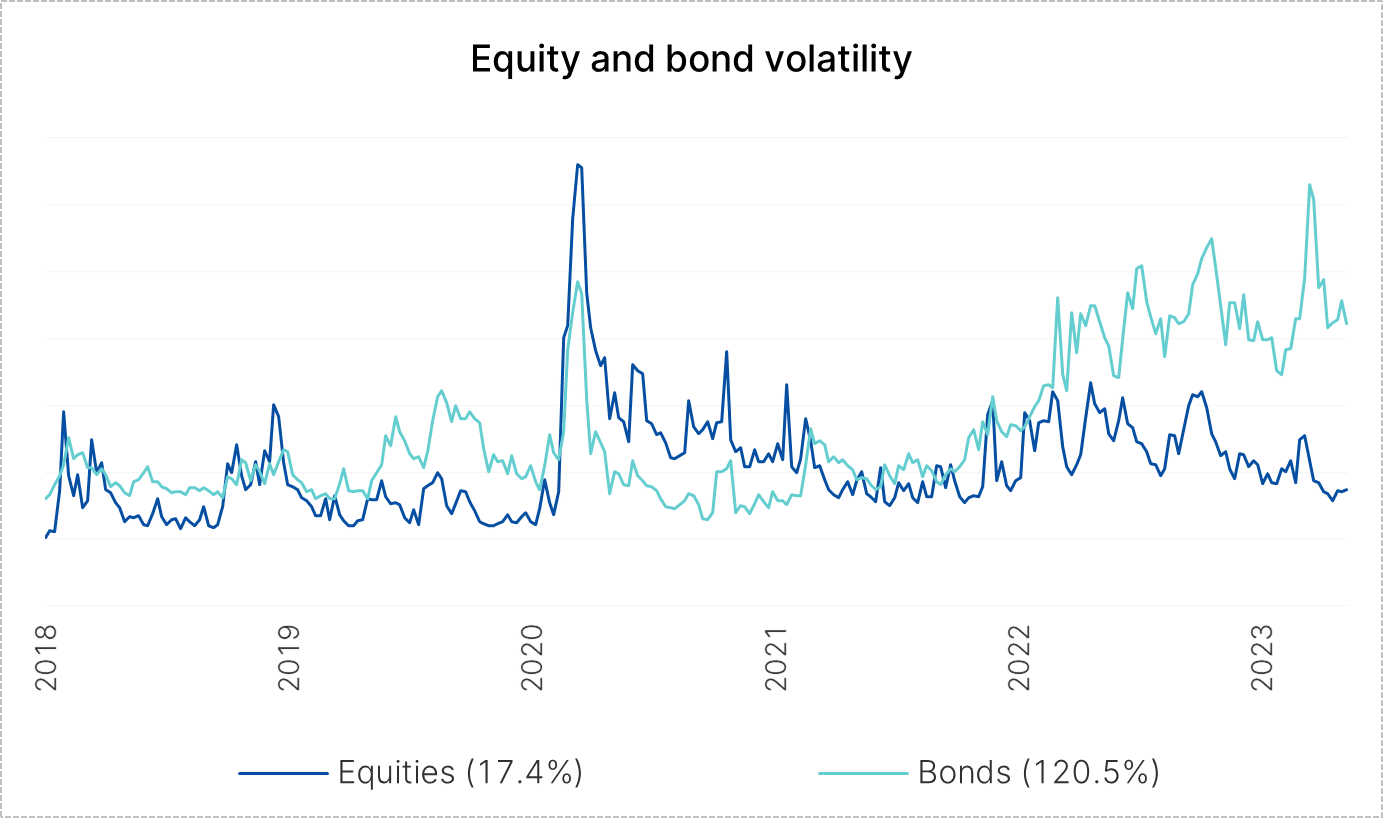
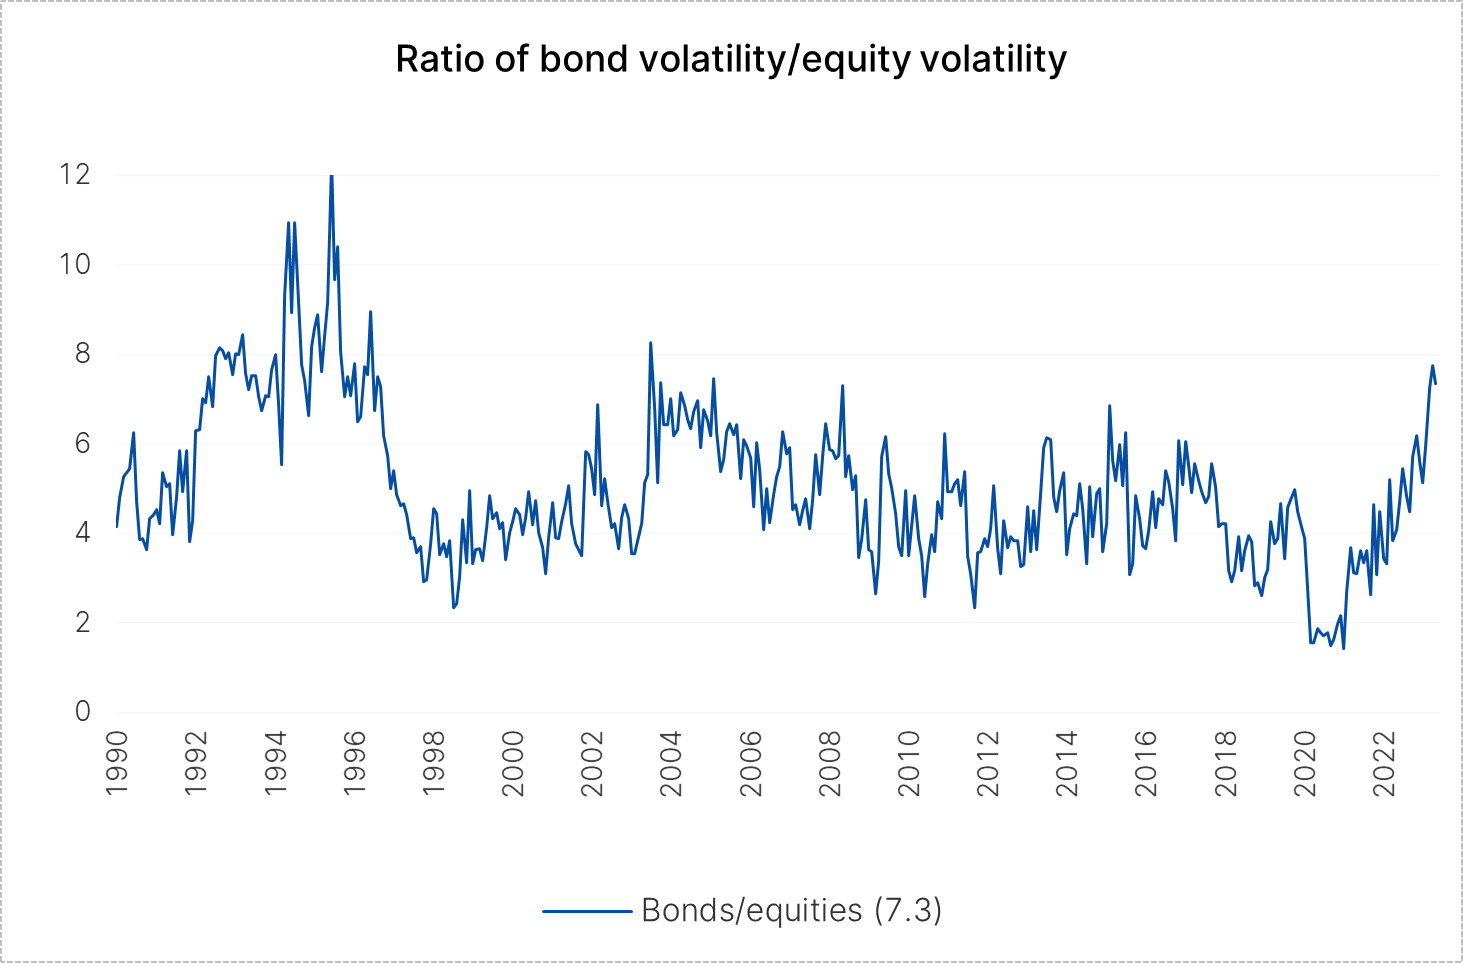
Having increased significantly, bond volatility has de-coupled from the stable volatility of equities since Mach 2023. In fact, the ratio of the two has never been bigger since 2003. What is the cause of the de-coupling of equity volatility from bond volatility; and, is it permanent?
Intuitively, the extraordinary volatility of bonds makes sense because it is fuelled by inflation, whose predictability has been limited during the aforementioned period. On the other side the countermeasures taken by central banks, which would not always match market expectations, also had an impact. In addition, the incident surrounding Silicon Valley Bank in March changed interest rate expectations and caused extreme levels of volatility.
Equity volatility, on the other hand, remains at the moderate lower end of its range and does not correspond to what one would expect in an environment perceived as uncertain.
Please note: past performance is no reliable indicator of future development.
Company earnings remain high
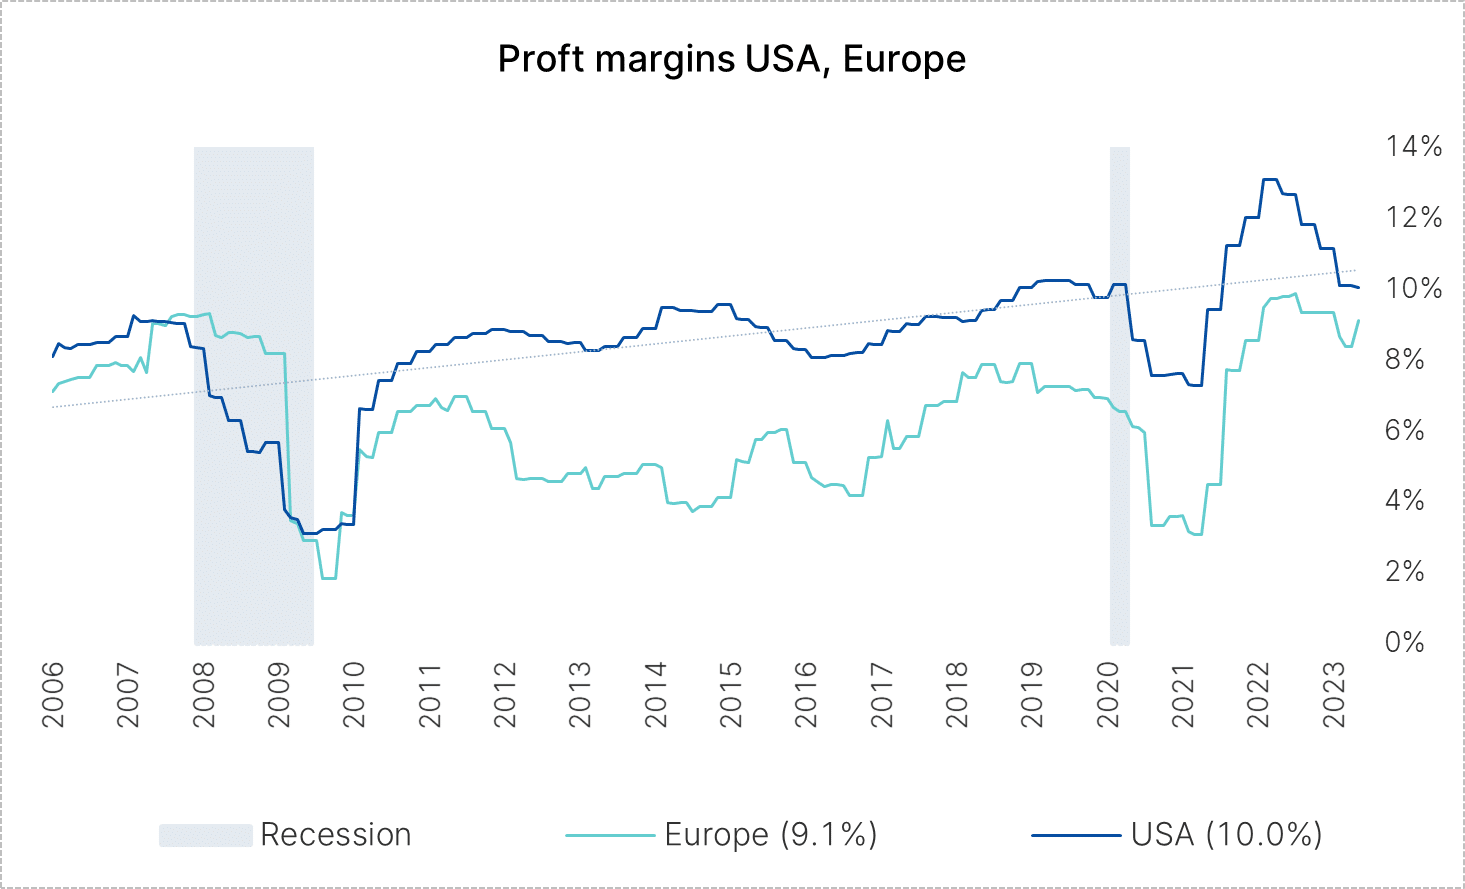
One reason for the current stability of equities can be found in profit margins and the earnings situation as a whole. In the USA, profit margins have moved significantly away from their peak (13.1%) at the end of the COVID pandemic. Nevertheless they have maintained their long-term upward trend at 10.0% and remain high. High company earnings are dampening volatility.
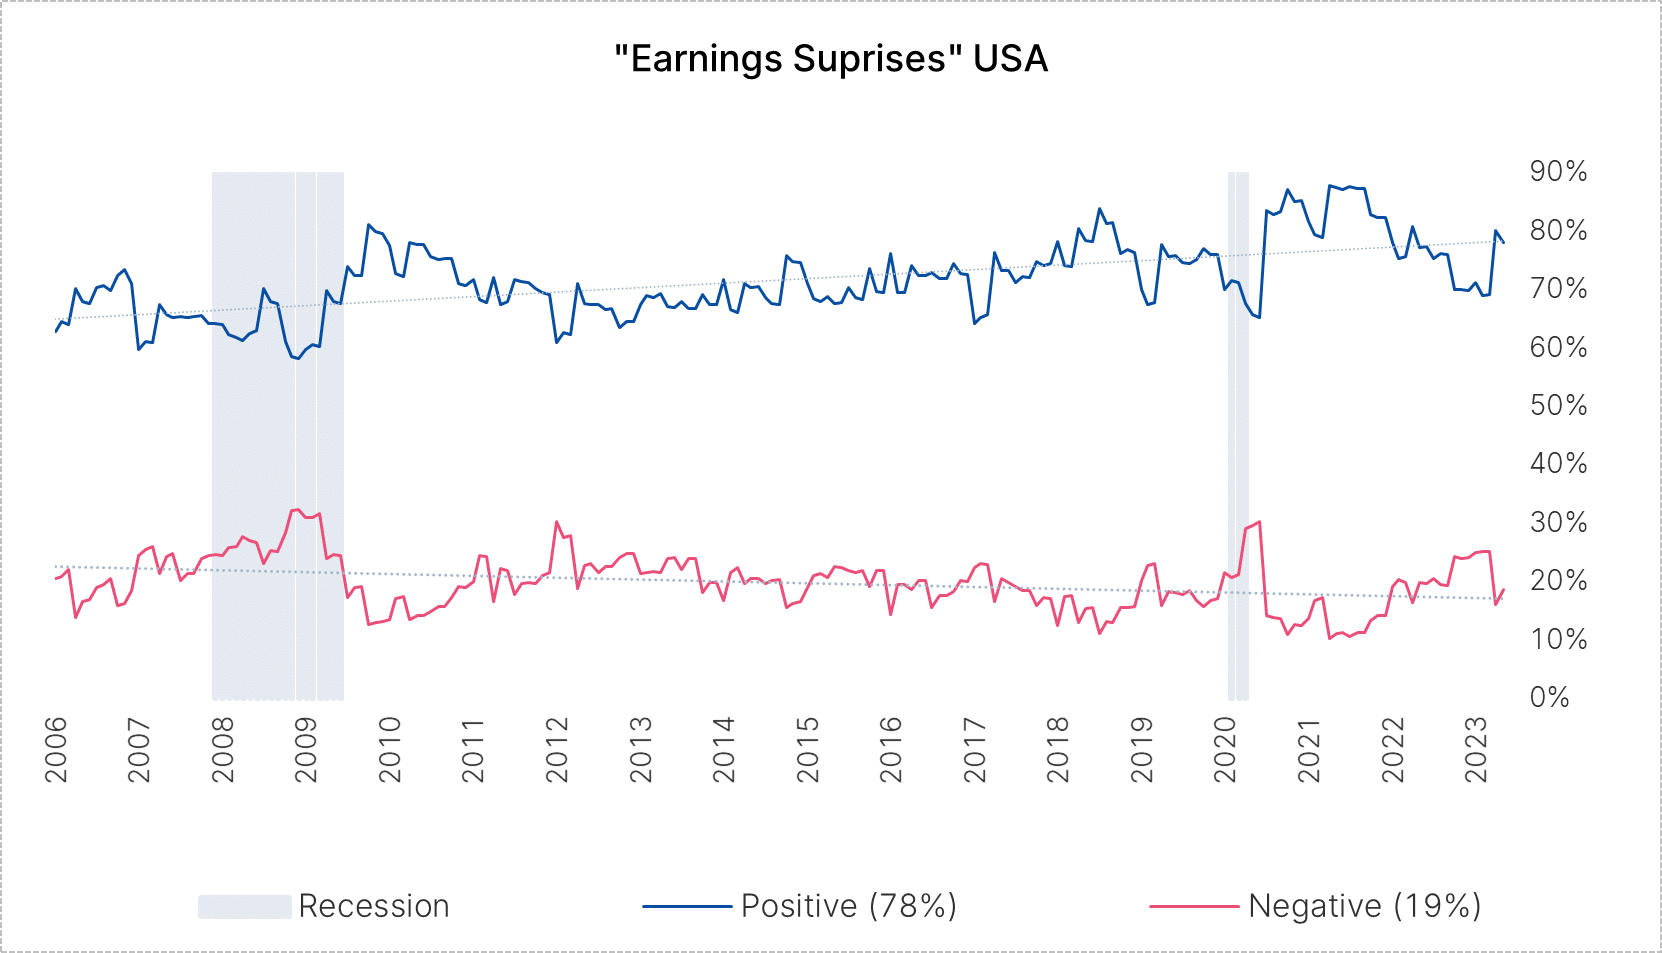
In addition, the US reporting season has shown a jump in positive earnings surprises for the first time in about 1.5 years. The negative surprises have fallen by roughly the same degree. Although expectations were already cut in the run-up, there is still no reason for an increase in volatility.
In the medium term, a narrowing of profit margins may be in the offing as the Fed seeks to take pressure off the depleted labour market. However, layoffs on a larger scale will take place if, and only if, the earnings situation in the corporate sector turns gloomy. While company profits are not a directly adjustable variable for the Fed, their reduction would be accepted.
Please note: past performance is no reliable indicator of future development.
Indicators suggest imminent recession
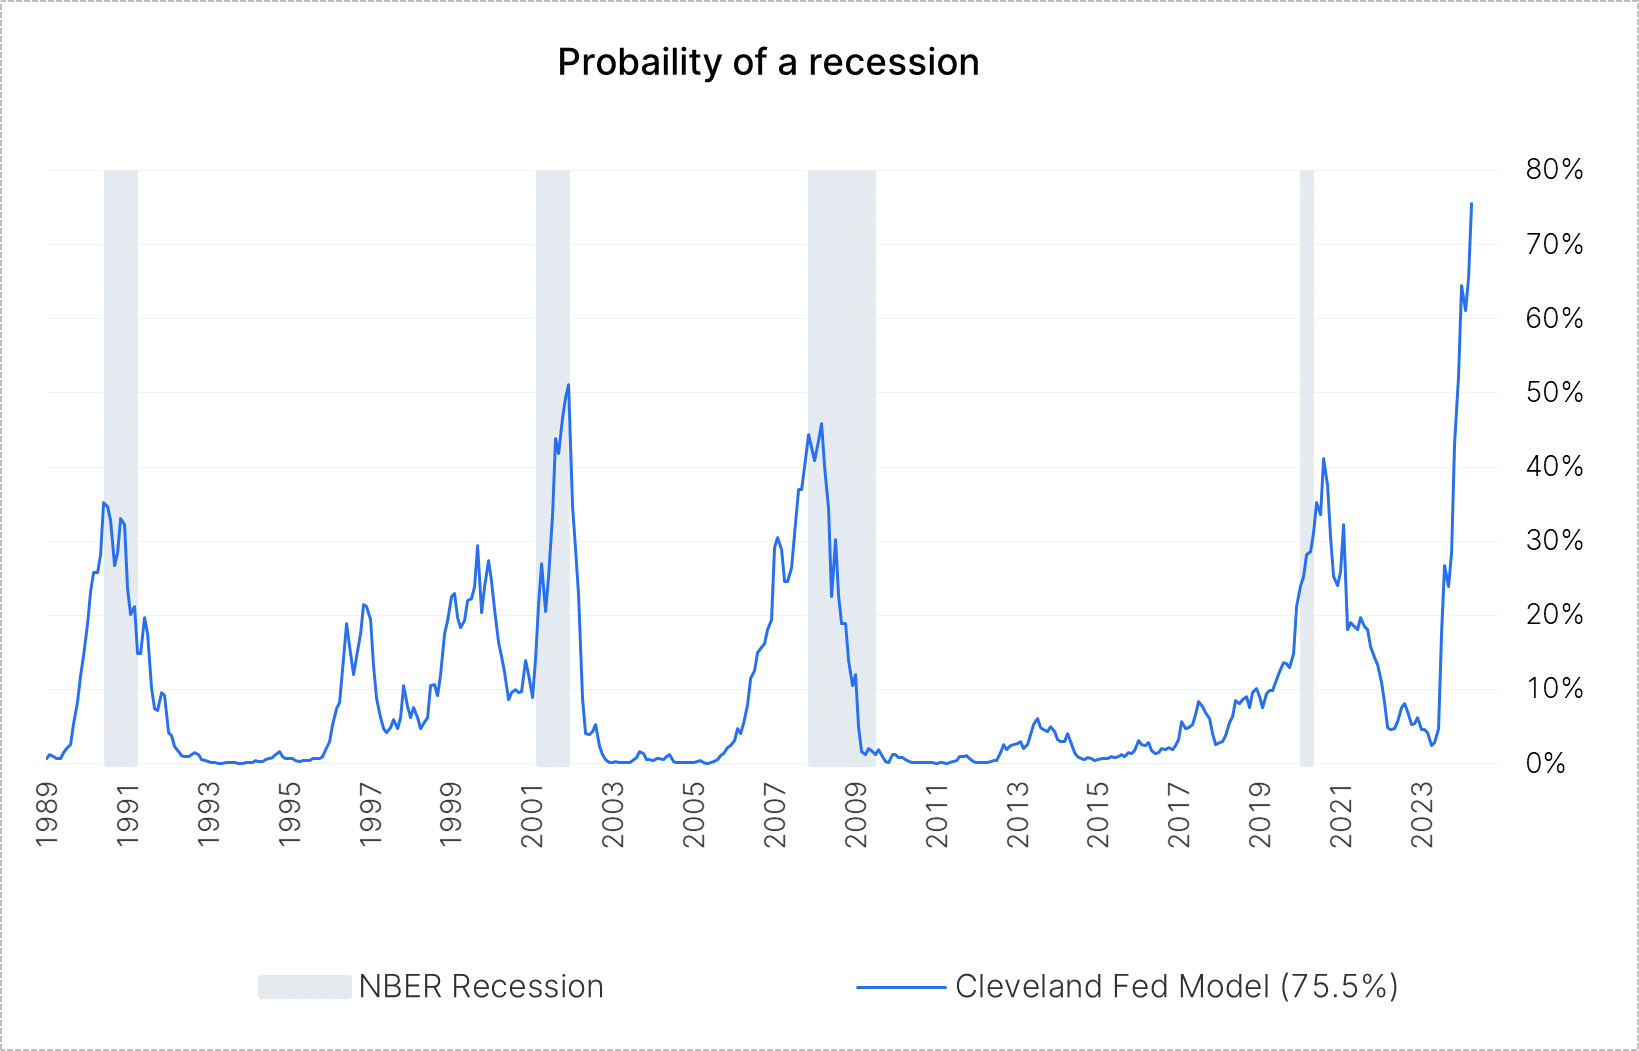
A noticeable recession in the USA represents the most significant risk for the equity markets. Recessions have been predicted in the past, but their timing and extent cannot be determined in advance from economic data. The Federal Reserve Bank of Cleveland calculates a probability model from the structure of the US yield curve. Its inversion has been a reliable harbinger of a recession, i.e. a situation where one receives more interest for a short investment than for a long-term one, which documents great uncertainty.
At 75.5%, the result is the highest since 1990, with the timing set at April 2024. At the same time, it is important to remember that this model is a purely mechanistic one and may not fully account for the situation. This refers to the scenario relating to the pandemic in which the overall economy was deliberately shut down, the associated massive shift in demand from services to goods, the government transfer payments, the global logistical bottlenecks, etc. These are factors that have not occurred in combination before.
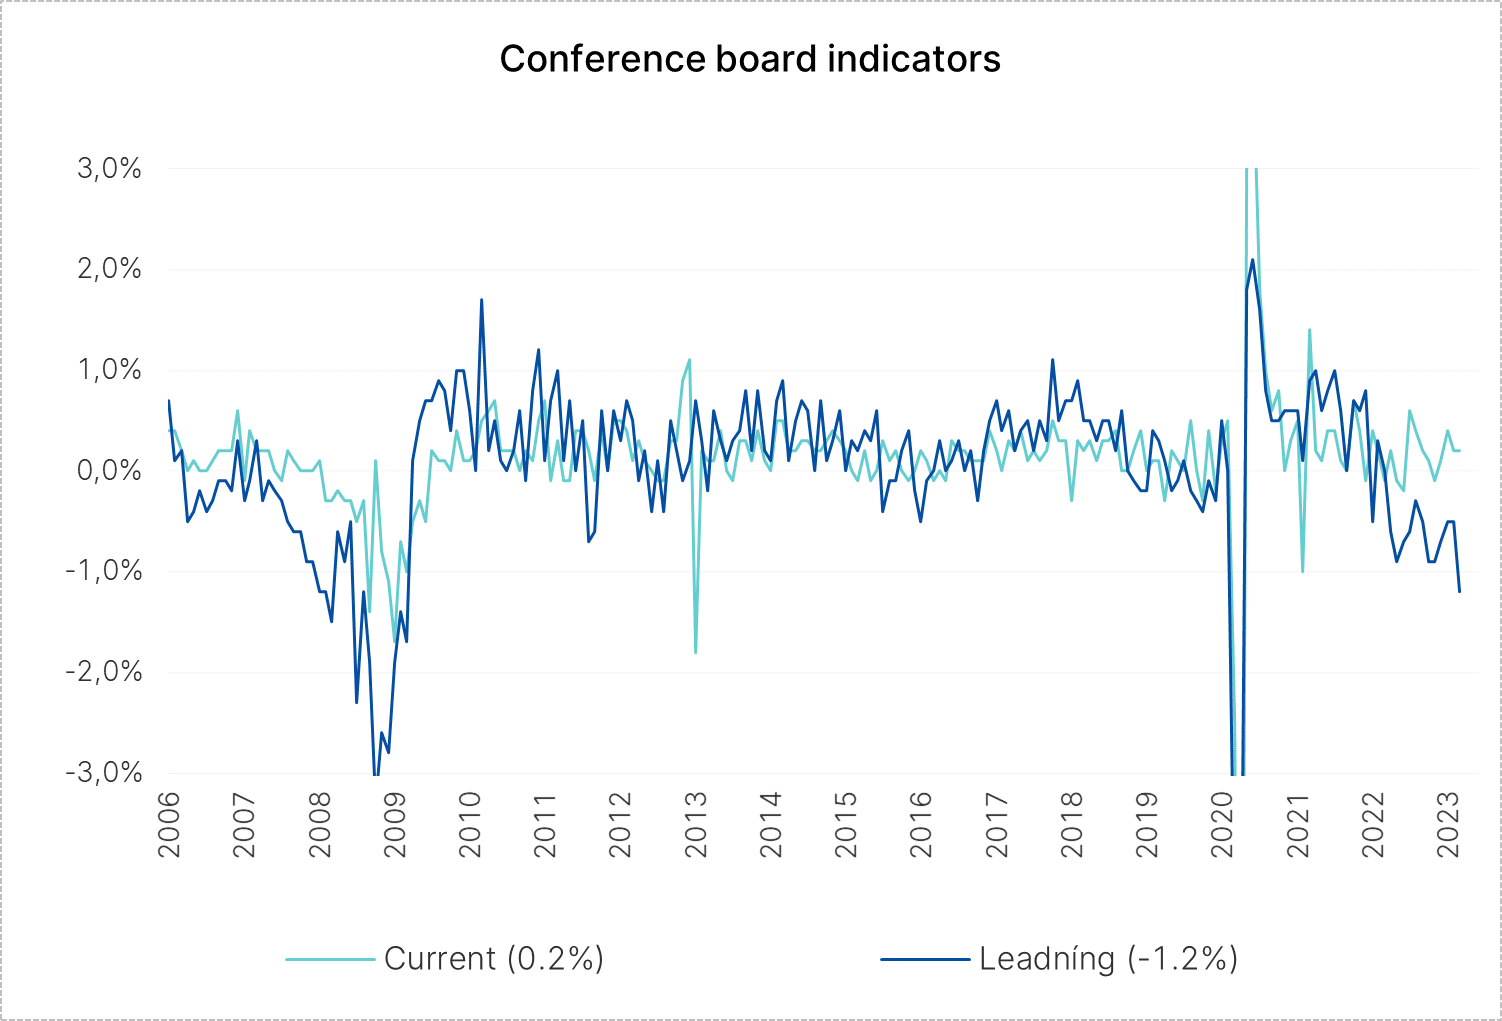
The leading indicator of the Conference Board also clearly suggests a recession. Interestingly, here, an indicator for the actual state of the economy is calculated in parallel, which is inconspicuous. This means: a stable picture of the US economy today – and with it, low equity volatility – but potential problems in the future.
Please note: past performance is no reliable indicator of future development.
Positions in the market
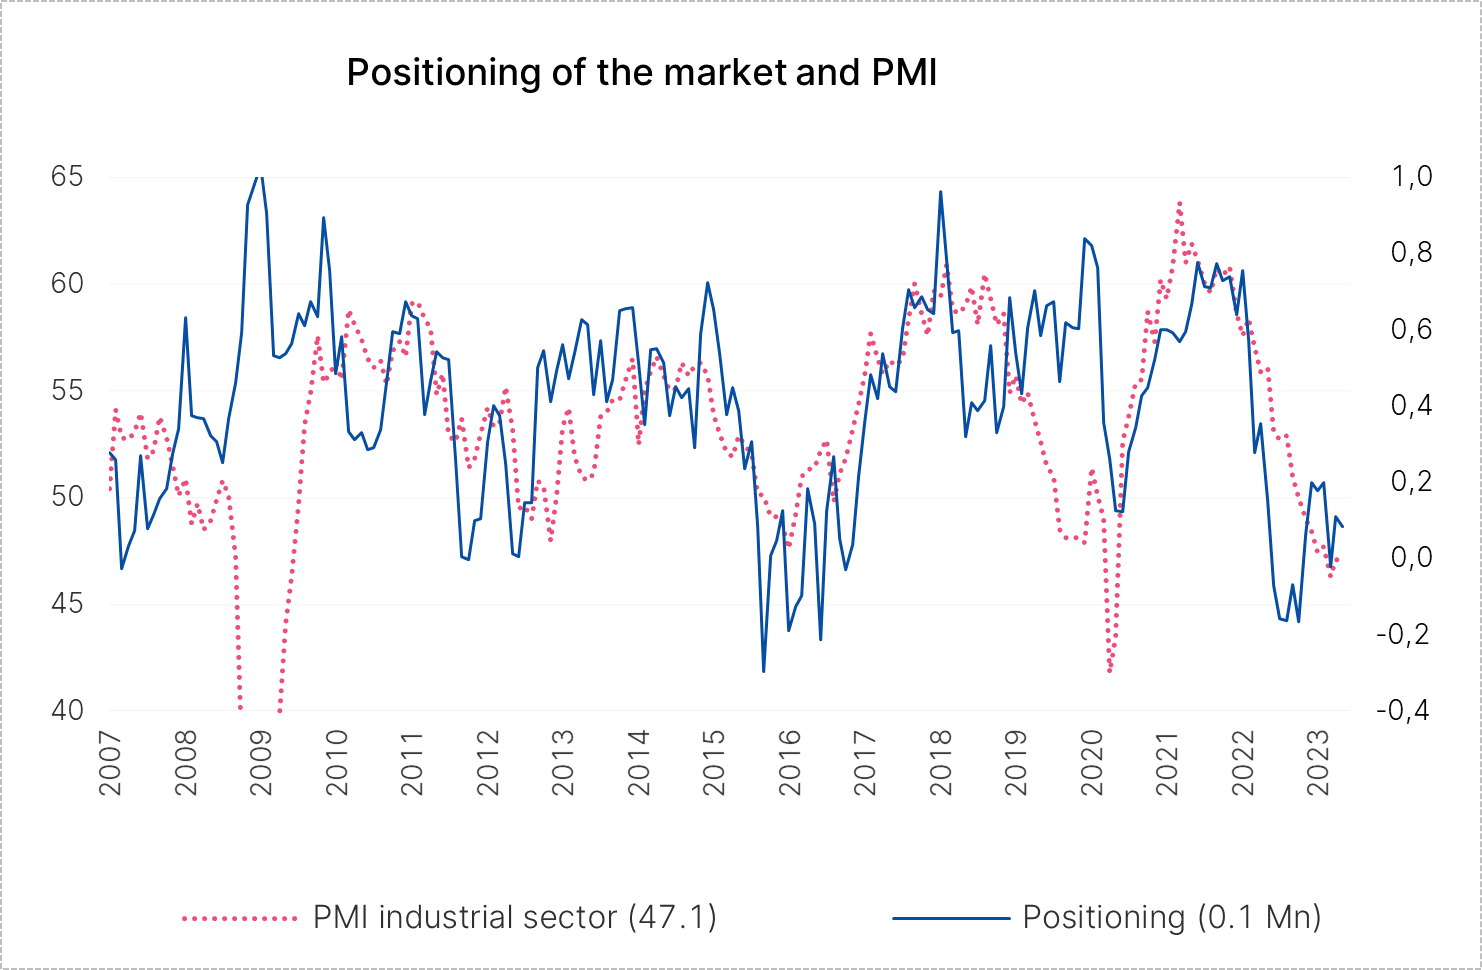
A remaining reason for the low volatility of equities is the positioning of the market, as measured by the number of speculative futures positions. This number is decidedly low. Its trend is comparable to the Purchasing Managers’ index (PMI) for the industrial sector, the leading indicator for economic activity in the US industry, which is under pressure. Now, it is easier for a sceptical market to process unpleasant news because much is already priced in. In addition, the extent to which the market can now become even shorter is limited.
Please note: past performance is no reliable indicator of future development.
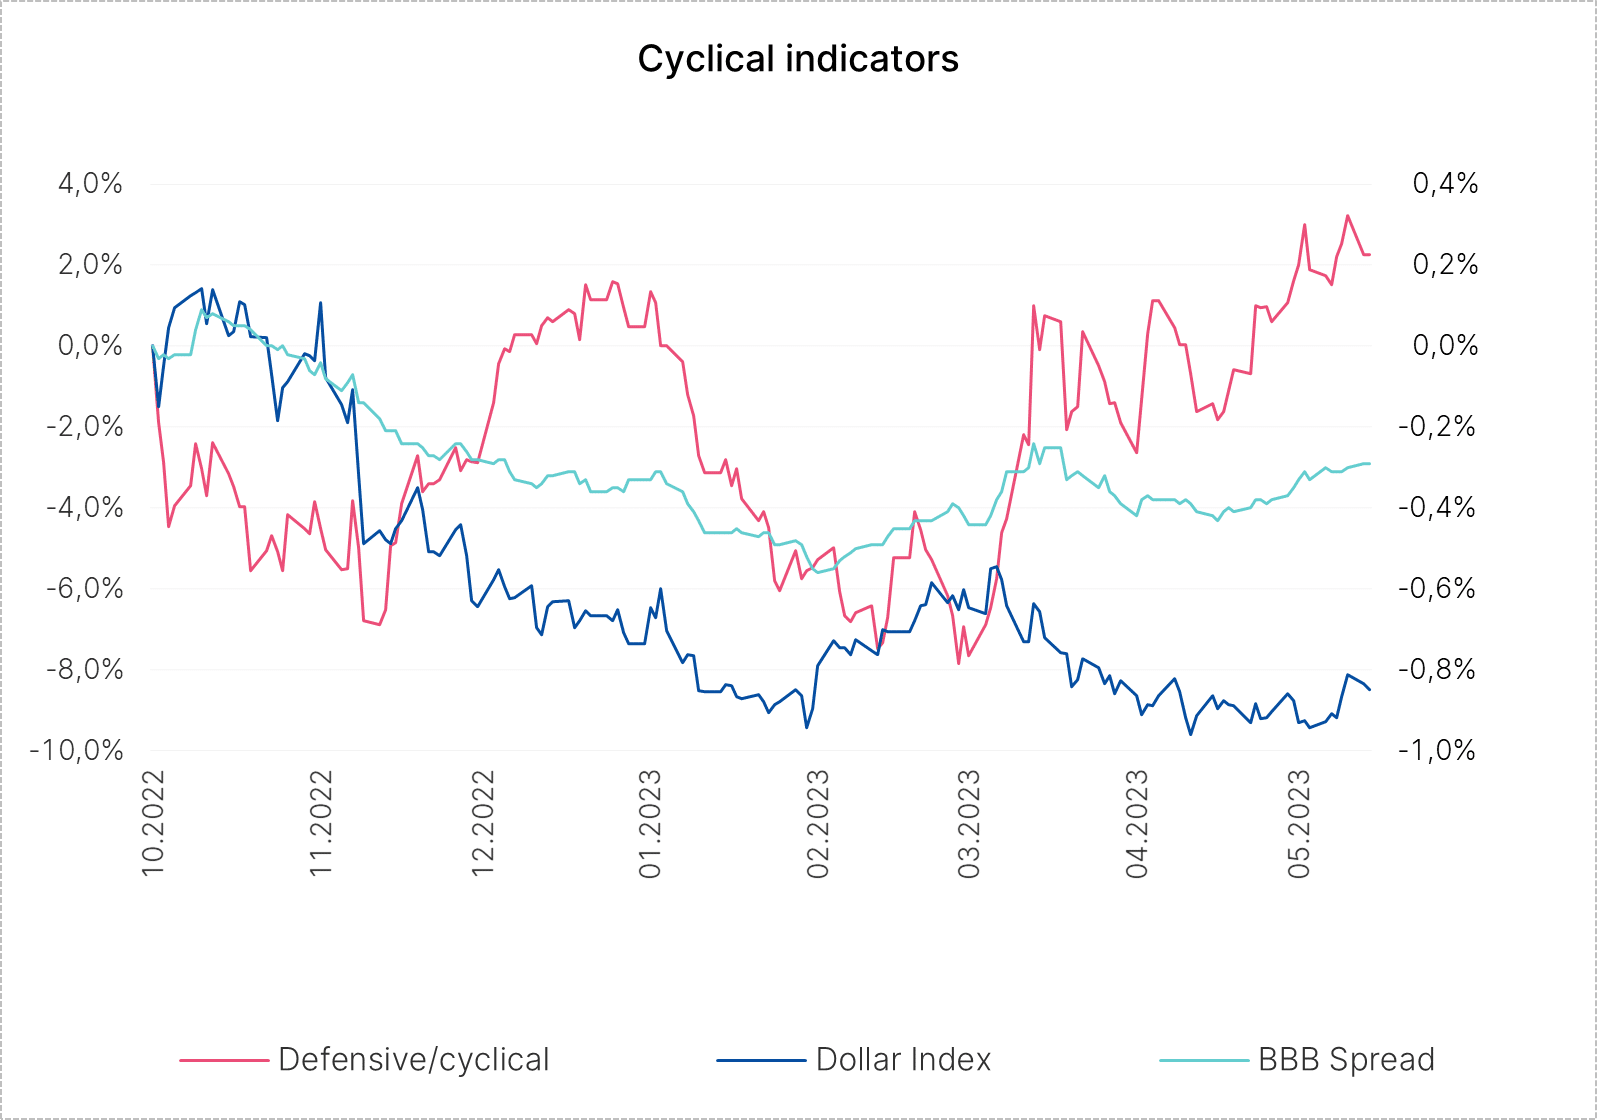
What indicators can you track to identify stress in the market? We offer three:
- the price ratio of defensive and cyclical equity sectors
- the US dollar index, which often gains strength in a stressed environment
- the BBB spread (risk premium for bonds with a “BBB” rating, corresponding to just investment grade, i.e. a good to very good credit rating) as a measure of credit risk
The last chart shows these indicators (USA values). Their time series shows a mixed picture. Defensive equities have recently outperformed cyclical equity sectors; the US dollar index, on the other hand, shows weakness; and the BBB spread has moved sideways.
Conclusion
The current comparatively low volatility of equities can be well argued. Bond volatility will remain high, as inflation is stabilising, but surprises can pop up at any time and affect the data.
For a glossary of technical terms, please visit this link: Fund Glossary | Erste Asset Management
Legal note:
Prognoses are no reliable indicator for future performance.
Legal disclaimer
This document is an advertisement. Unless indicated otherwise, source: Erste Asset Management GmbH. The language of communication of the sales offices is German and the languages of communication of the Management Company also include English.
The prospectus for UCITS funds (including any amendments) is prepared and published in accordance with the provisions of the InvFG 2011 as amended. Information for Investors pursuant to § 21 AIFMG is prepared for the alternative investment funds (AIF) administered by Erste Asset Management GmbH pursuant to the provisions of the AIFMG in conjunction with the InvFG 2011.
The currently valid versions of the prospectus, the Information for Investors pursuant to § 21 AIFMG, and the key information document can be found on the website www.erste-am.com under “Mandatory publications” and can be obtained free of charge by interested investors at the offices of the Management Company and at the offices of the depositary bank. The exact date of the most recent publication of the prospectus, the languages in which the fund prospectus or the Information for Investors pursuant to Art 21 AIFMG and the key information document are available, and any other locations where the documents can be obtained are indicated on the website www.erste-am.com. A summary of the investor rights is available in German and English on the website www.erste-am.com/investor-rights and can also be obtained from the Management Company.
The Management Company can decide to suspend the provisions it has taken for the sale of unit certificates in other countries in accordance with the regulatory requirements.
Note: You are about to purchase a product that may be difficult to understand. We recommend that you read the indicated fund documents before making an investment decision. In addition to the locations listed above, you can obtain these documents free of charge at the offices of the referring Sparkassen bank and the offices of Erste Bank der oesterreichischen Sparkassen AG. You can also access these documents electronically at www.erste-am.com.
Our analyses and conclusions are general in nature and do not take into account the individual characteristics of our investors in terms of earnings, taxation, experience and knowledge, investment objective, financial position, capacity for loss, and risk tolerance. Past performance is not a reliable indicator of the future performance of a fund.
Please note: Investments in securities entail risks in addition to the opportunities presented here. The value of units and their earnings can rise and fall. Changes in exchange rates can also have a positive or negative effect on the value of an investment. For this reason, you may receive less than your originally invested amount when you redeem your units. Persons who are interested in purchasing units in investment funds are advised to read the current fund prospectus(es) and the Information for Investors pursuant to § 21 AIFMG, especially the risk notices they contain, before making an investment decision. If the fund currency is different than the investor’s home currency, changes in the relevant exchange rate can positively or negatively influence the value of the investment and the amount of the costs associated with the fund in the home currency.
We are not permitted to directly or indirectly offer, sell, transfer, or deliver this financial product to natural or legal persons whose place of residence or domicile is located in a country where this is legally prohibited. In this case, we may not provide any product information, either.
Please consult the corresponding information in the fund prospectus and the Information for Investors pursuant to § 21 AIFMG for restrictions on the sale of the fund to American or Russian citizens.
It is expressly noted that this communication does not provide any investment recommendations, but only expresses our current market assessment. Thus, this communication is not a substitute for investment advice.
This document does not represent a sales activity of the Management Company and therefore may not be construed as an offer for the purchase or sale of financial or investment instruments.
Erste Asset Management GmbH is affiliated with the Erste Bank and austrian Sparkassen banks.
Please also read the “Information about us and our securities services” published by your bank.
More on the topic

Investment View | February 2025
What’s happening on the markets? In our Investment View, the experts of our Investment Division regularly provide insights of current market events and their opinion on the various asset classes.