
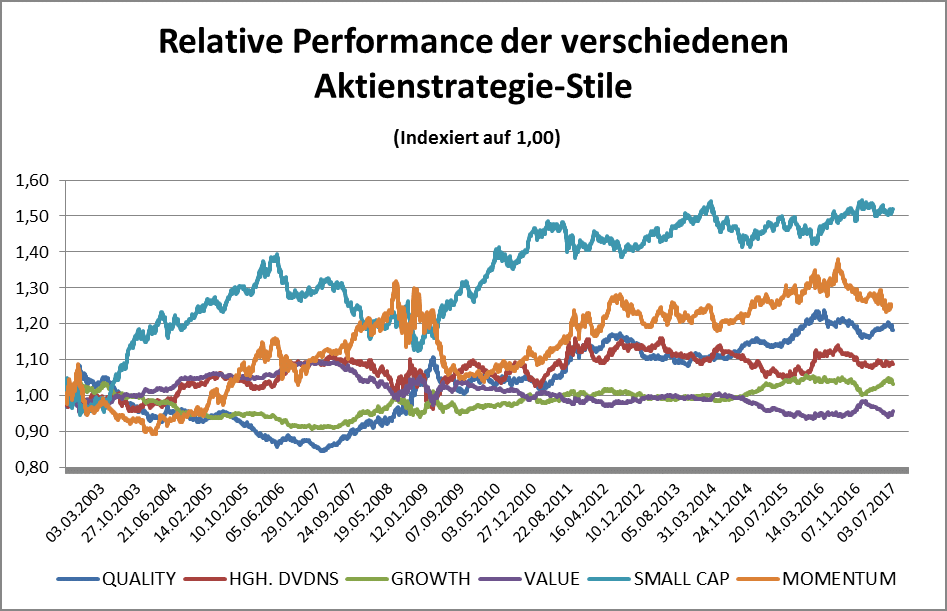
Having defined and explained various management styles in equity management in part 1, we will now have a look at the specific styles and their return/risk ratio over time.
Sources: Erste AM; Bloomberg; the return and risk ratios do not take fees, duties, or taxes into account. Past performance is no reliable indicator of future development.
Looking at the performance of the different styles, we find the following:
- The performance of the various styles may differ a lot.
- Small caps outperformed the market significantly over the observation period (50%, which equals 2.74% p.a.).
- Momentum was a successful strategy, but also underwent three phases of clear underperformance.
- In 2007, a trend reversal took place. Since then, value shares have underperformed the overall market, whereas quality and growth shares have outperformed it.
The underperformance of value comes as a surprise, given what Fama/French established in their famous 1992 paper (which everyone in this field will come across sooner or later). According to the paper, small caps and value are two factors that could explain outperformance. Until the early 1990s, that was indeed the case, but apparently outperformance phases do not have to be of a sustainable nature.
The analysis of the value segment over a longer period of time (from 1991 onwards) reveals different phases.
Phase 1 (1991-1994): yield curve turning steeper
Value outperforms growth significantly
Phase 2 (1994-1999): the birth of the Internet
Boom phase of growth with TMT bubble at the end
Commodity prices fall
Yield curve flattening
Phase 3 (1999-2007): emerging markets (BRIC) catching up – commodity boom
Strong phase of value; quality and growth were underperformers and had “fallen out of fashion”
Commodity prices doubling
Phase 4 (2007 to date): “After the financial crisis”, deflation, interest rates are falling continuously
Value is the weakest style of all.
An important finding is the fact that one style may outperform the rest over a long period of time while being among the absolute losers in a different phase.
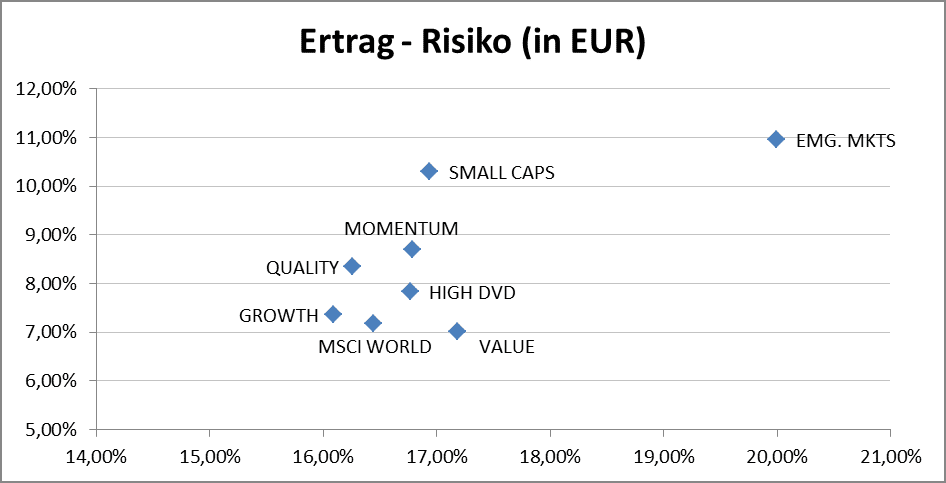
Return/risk ratio (2002-2017):
Sources: Erste AM; Bloomberg; the return and risk ratios do not take fees, duties, or taxes into account. Ratios based on weekly data.
Past performance is no reliable indicator of future development.
The chart above shows the return over the past 15 years in relation to the risk (as measured by volatility). These are our findings:
Small caps and emerging markets have yielded the highest rate of return. However, the significantly higher rate of return for the emerging markets is “bought” by significantly higher risk.
In terms of return, value and growth shares were neck to neck for a while, although the risk of growth shares was lower, which made them the better choice.
Quality shares were ideal in this context, as they generated a higher return at lower risk.
Betting on the winners of the past was no bad strategy either, since it would have generated an outperformance of 2% at slightly higher risk.
High-dividend shares also achieved a higher rate of return, although the return/risk profile was not ideal.
However, this is the picture of the past 15 years; it is by no means clear that the coming 15 years will look the same. Many value shares contain a higher degree of risk than the overall market. But in what cases will the investor be compensated for the higher risk?
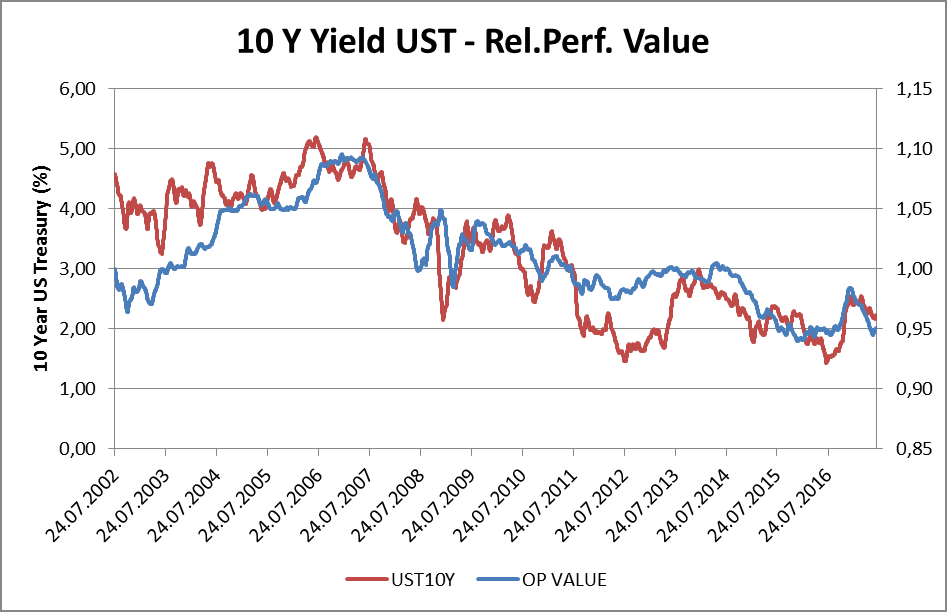
What drives the outperformance of value and style in general?
A strong correlation between US Treasuries and the value style has existed over the past 15 years. This may on the one hand be due to the fact that the value segment currently contains a lot of financial companies (i.e. financials). Financials benefit from a steeper yield curve, so when the 10Y yields are rising, the value segment will be outperforming the other market segments, and vice versa. Since 2007, the 10Y yields have fallen from 5% to slightly above 1%. In such a scenario, falling yields would always go along with underperforming value shares. Conversely, growth and quality would outperform the market amid falling interest rates.
Sources: Erste AM; Bloomberg; the return and risk ratios do not take fees, duties, or taxes into account.
Past performance is no reliable indicator of future development.
The yields also describe very well the development over the past months. The drastic increase in interest rates from July 2016 onwards heralded a phase of value outperformance, but in the wake of the decline of yields in 2017, said outperformance has quickly come to an end.
The timing of styles is generally difficult, given that the correlation with external factors is unstable. The correlation between value and 10Y yields has not always been as high as today. But the following statement still holds:
For value to outperform, at least one of the following conditions should be prevalent:
- Long-term yields are rising
- Short-term yields are not rising, but the yield curve is turning steeper
- Commodity prices are rising drastically
Quality and growth shares, on the other hand, outperform the overall market if
- Interest rates are falling
- The yield curve is flattening
- Commodity prices are falling
Legal disclaimer
This document is an advertisement. Unless indicated otherwise, source: Erste Asset Management GmbH. The language of communication of the sales offices is German and the languages of communication of the Management Company also include English.
The prospectus for UCITS funds (including any amendments) is prepared and published in accordance with the provisions of the InvFG 2011 as amended. Information for Investors pursuant to § 21 AIFMG is prepared for the alternative investment funds (AIF) administered by Erste Asset Management GmbH pursuant to the provisions of the AIFMG in conjunction with the InvFG 2011.
The currently valid versions of the prospectus, the Information for Investors pursuant to § 21 AIFMG, and the key information document can be found on the website www.erste-am.com under “Mandatory publications” and can be obtained free of charge by interested investors at the offices of the Management Company and at the offices of the depositary bank. The exact date of the most recent publication of the prospectus, the languages in which the fund prospectus or the Information for Investors pursuant to Art 21 AIFMG and the key information document are available, and any other locations where the documents can be obtained are indicated on the website www.erste-am.com. A summary of the investor rights is available in German and English on the website www.erste-am.com/investor-rights and can also be obtained from the Management Company.
The Management Company can decide to suspend the provisions it has taken for the sale of unit certificates in other countries in accordance with the regulatory requirements.
Note: You are about to purchase a product that may be difficult to understand. We recommend that you read the indicated fund documents before making an investment decision. In addition to the locations listed above, you can obtain these documents free of charge at the offices of the referring Sparkassen bank and the offices of Erste Bank der oesterreichischen Sparkassen AG. You can also access these documents electronically at www.erste-am.com.
Our analyses and conclusions are general in nature and do not take into account the individual characteristics of our investors in terms of earnings, taxation, experience and knowledge, investment objective, financial position, capacity for loss, and risk tolerance. Past performance is not a reliable indicator of the future performance of a fund.
Please note: Investments in securities entail risks in addition to the opportunities presented here. The value of units and their earnings can rise and fall. Changes in exchange rates can also have a positive or negative effect on the value of an investment. For this reason, you may receive less than your originally invested amount when you redeem your units. Persons who are interested in purchasing units in investment funds are advised to read the current fund prospectus(es) and the Information for Investors pursuant to § 21 AIFMG, especially the risk notices they contain, before making an investment decision. If the fund currency is different than the investor’s home currency, changes in the relevant exchange rate can positively or negatively influence the value of the investment and the amount of the costs associated with the fund in the home currency.
We are not permitted to directly or indirectly offer, sell, transfer, or deliver this financial product to natural or legal persons whose place of residence or domicile is located in a country where this is legally prohibited. In this case, we may not provide any product information, either.
Please consult the corresponding information in the fund prospectus and the Information for Investors pursuant to § 21 AIFMG for restrictions on the sale of the fund to American or Russian citizens.
It is expressly noted that this communication does not provide any investment recommendations, but only expresses our current market assessment. Thus, this communication is not a substitute for investment advice.
This document does not represent a sales activity of the Management Company and therefore may not be construed as an offer for the purchase or sale of financial or investment instruments.
Erste Asset Management GmbH is affiliated with the Erste Bank and austrian Sparkassen banks.
Please also read the “Information about us and our securities services” published by your bank.