
The United States and Europe are home of the two most important stock markets globally. Together they account for more than 80% of the capitalization of developed markets. Below we present six charts that look at the European and the US stock markets, comparing their performance, sector composition, earnings developments as well as their valuation – mainly with the aim of shedding light on the enduring underperformance of European stocks vis-à-vis the US.
The story, which these charts are telling is that Europe’s long-lasting underperformance has been a combination of both structural and cyclical factors. The latter, particularly earnings and valuation trends, could help European stocks to stage a rebound versus their US peers in the course of the year. However, a more pronounced reversal of Europe’s relative performance would also require a change in the broader economic backdrop, such as a slowdown in the relentless growth of the tech-sector and a recovery of Europe’s troubled banking sector. Whether that will happen in the foreseeable future is anybody’s guess because one should not ignore the first sentence of this blog’s title (which is paraphrasing a line from the wicked ogre Shrek¹): charts do not tell us anything about the future.
Europe’s dismal performance
The European stock market has underperformed the US market over 30, 20, 10 and 5 years. Since the financial crisis this trend has even accelerated, with the Stoxx 600 losing almost 40% relative to the S&P 500 (in local currency, including dividends) since 2007.
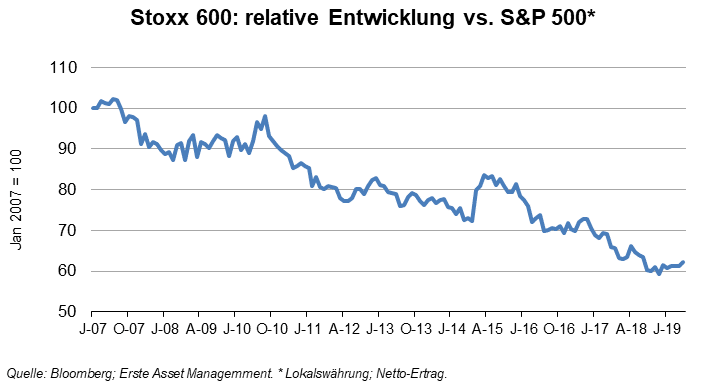
* J-07 = July 2007, 0-07 = October 2007, …
Sector composition has not helped
Among the main reasons for Europe’s underperformance is the different sector composition of the two markets. In the US, information technology, which has been among the best performing industries over the past decade, is the biggest sector. Its weight of more than 20% is four times higher than the sector’s share in the European market. In contrast, in Europe the sector with the highest weight (>17% or 4.3 percentage points higher than in the US) is the financial sector, which has had a mediocre performance over the past decade.
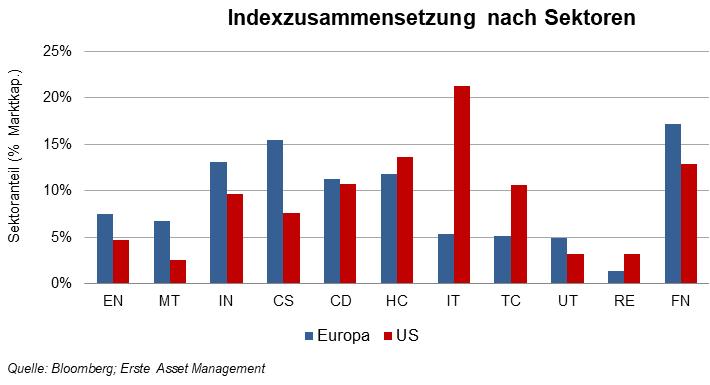
EN=Energy, MT=Metals, IN=Industry, CS=Consumer staples,, CD= Consumer discretionary, CD=Consumer durables, HC=Health care, IT=Information Technology, UT=Utilities, RE= Real Estate, FN= Financials
Overall, sectors that a decade ago had smaller weights in Europe than in the US outperformed over the past ten years, while sectors accounting for a higher share in Europe – financials as well as utilities and telecoms – underperformed, as is shown in the two charts below: the left chart shows that there was a negative relationship between sector weight and performance in Europe, while the right chart shows the opposite result for the US. Roughly half of Europe’s underperformance over this period can be traced to different sector exposures.
Sector weight versus relative performance
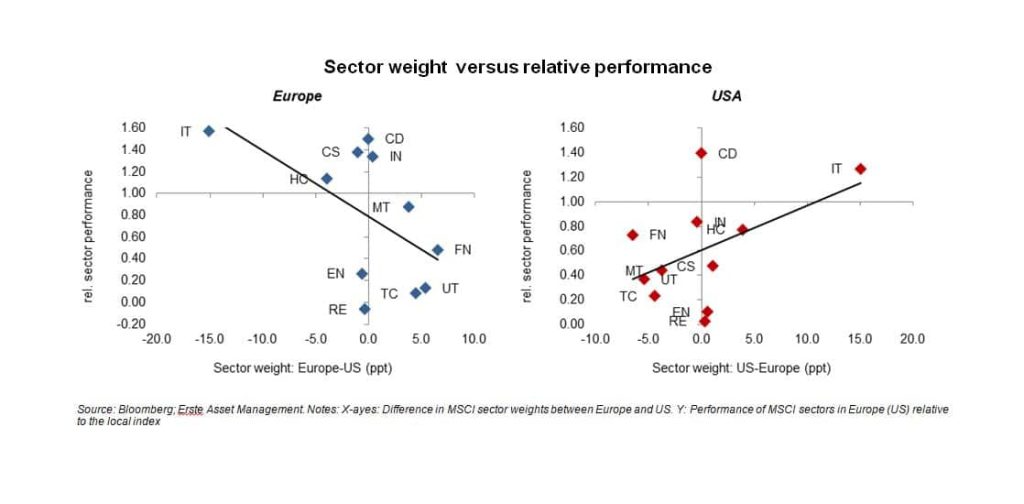
EN=Energy, MT=Metals, IN=Industry, CS=Consumer staples,, CD= Consumer discretionary, CD=Consumer durables, HC=Health care, IT=Information Technology, UT=Utilities, RE= Real Estate, FN= Financials
Americans are from Growthland, Europeans are from Valueland
Another difference between the stock markets in the US and in Europe has been the factor exposure of their respective corporate sectors. This is partly related to the sector composition described above but it is also due to company specifics across sectors. The chart below shows that the relative performance between European and US stock markets has been closely related to the value/growth cycle, which has not been very kind to European stocks for more than a decade.
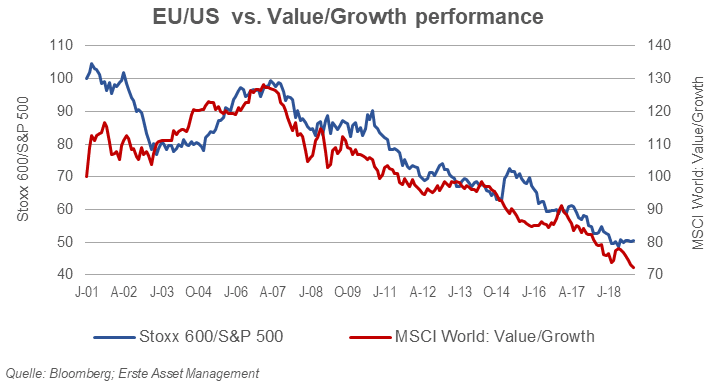
* J-01 = Jänner 2001, A-02 = April 02, J-03 = Juli 2003 0-04 = Oktober 2004, …
Earnings: Europe has been a long-term laggard
Earnings are another key explanation for Europe’s lackluster relative performance. The slow European recovery after the financial crisis – compared to the US – held back growth in the corporate sector. Over the period from 2009 to 2018, annual topline growth in Europe was almost three percentage points lower in Europe (1.5% vs. 4.4%). In addition, operating margins in the US showed an upward trend while they moved sideways in Europe. As a result, annual earnings growth in Europe was five percentage points lower than in the US. Unsurprisingly, during most of the period, earnings expectations in Europe were weaker than in the US, which is reflected in the relative index performance (chart below).
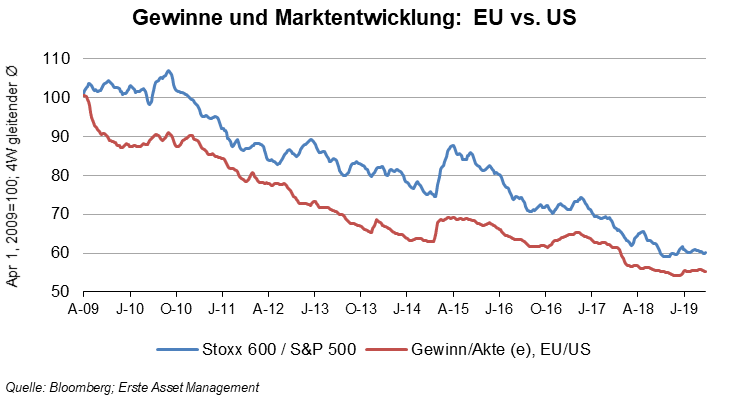
* A-09 = April 2009, J-10 = Juli 2010, 0-10 = Oktober 2010, J-11 = Jänner 2011 …
Valuation: Trading at a discount
Since the mid-2000s (the longest period for which we have forward earnings data) European equities have been, on average, trading at a discount to their US peers. After the financial crisis, the valuation gap moved mostly in a range between -17% and -5%, without a clear trend. Since 3Q18 the discount has been close to the higher end of the range, fueling expectations that mean reversion could trigger at least a temporary rebound of European stocks versus US stocks.²
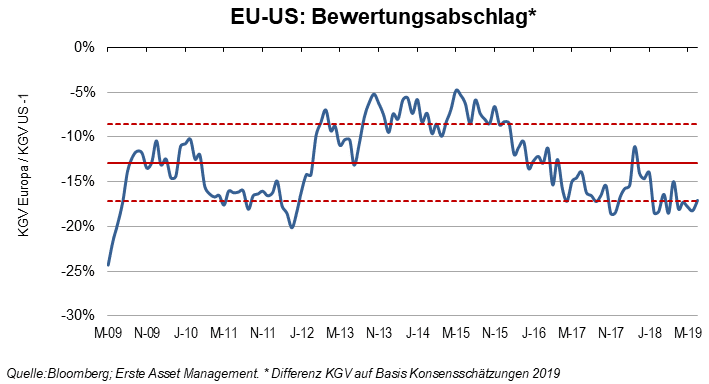
M-09 = Mai 09, N-09 = November 2009, …
[1] “Well, the stars don’t tell the future, Donkey, they tell stories. Skrek” (2001)
[2] It needs to be noted that the valuation gap also reflects differences in the sector composition. One could argue that Europe looks artificially undervalued because ‘cheaper’ sectors like financials carry a bigger weight. However, adjusting for the sector impact is not without pitfalls and a closer look at sector multiples shows that Europe’s undervaluation is a relatively robust fact.
Legal note:
Prognoses are no reliable indicator for future performance.
Legal disclaimer
This document is an advertisement. Unless indicated otherwise, source: Erste Asset Management GmbH. The language of communication of the sales offices is German and the languages of communication of the Management Company also include English.
The prospectus for UCITS funds (including any amendments) is prepared and published in accordance with the provisions of the InvFG 2011 as amended. Information for Investors pursuant to § 21 AIFMG is prepared for the alternative investment funds (AIF) administered by Erste Asset Management GmbH pursuant to the provisions of the AIFMG in conjunction with the InvFG 2011.
The currently valid versions of the prospectus, the Information for Investors pursuant to § 21 AIFMG, and the key information document can be found on the website www.erste-am.com under “Mandatory publications” and can be obtained free of charge by interested investors at the offices of the Management Company and at the offices of the depositary bank. The exact date of the most recent publication of the prospectus, the languages in which the fund prospectus or the Information for Investors pursuant to Art 21 AIFMG and the key information document are available, and any other locations where the documents can be obtained are indicated on the website www.erste-am.com. A summary of the investor rights is available in German and English on the website www.erste-am.com/investor-rights and can also be obtained from the Management Company.
The Management Company can decide to suspend the provisions it has taken for the sale of unit certificates in other countries in accordance with the regulatory requirements.
Note: You are about to purchase a product that may be difficult to understand. We recommend that you read the indicated fund documents before making an investment decision. In addition to the locations listed above, you can obtain these documents free of charge at the offices of the referring Sparkassen bank and the offices of Erste Bank der oesterreichischen Sparkassen AG. You can also access these documents electronically at www.erste-am.com.
Our analyses and conclusions are general in nature and do not take into account the individual characteristics of our investors in terms of earnings, taxation, experience and knowledge, investment objective, financial position, capacity for loss, and risk tolerance. Past performance is not a reliable indicator of the future performance of a fund.
Please note: Investments in securities entail risks in addition to the opportunities presented here. The value of units and their earnings can rise and fall. Changes in exchange rates can also have a positive or negative effect on the value of an investment. For this reason, you may receive less than your originally invested amount when you redeem your units. Persons who are interested in purchasing units in investment funds are advised to read the current fund prospectus(es) and the Information for Investors pursuant to § 21 AIFMG, especially the risk notices they contain, before making an investment decision. If the fund currency is different than the investor’s home currency, changes in the relevant exchange rate can positively or negatively influence the value of the investment and the amount of the costs associated with the fund in the home currency.
We are not permitted to directly or indirectly offer, sell, transfer, or deliver this financial product to natural or legal persons whose place of residence or domicile is located in a country where this is legally prohibited. In this case, we may not provide any product information, either.
Please consult the corresponding information in the fund prospectus and the Information for Investors pursuant to § 21 AIFMG for restrictions on the sale of the fund to American or Russian citizens.
It is expressly noted that this communication does not provide any investment recommendations, but only expresses our current market assessment. Thus, this communication is not a substitute for investment advice.
This document does not represent a sales activity of the Management Company and therefore may not be construed as an offer for the purchase or sale of financial or investment instruments.
Erste Asset Management GmbH is affiliated with the Erste Bank and austrian Sparkassen banks.
Please also read the “Information about us and our securities services” published by your bank.
More on the topic

Deficit spiraling out of control: French government plans drastic austerity program
The high deficit in the French national budget is forcing the new government to implement drastic austerity measures. Investors are keeping a close eye on the announced plans, as the tense financial situation has been noticeable on the stock market for some time.