
Diagrams are essential in the economic context to make changes over time clear and visually tangible. And also, because people in all areas – universities, the financial industry, media consumers – are sceptical of data graveyards. The charts in this blog do not constitute a complete list. They are topics that currently affect us as asset managers, and they are intended to arouse interest in this important form of presentation.
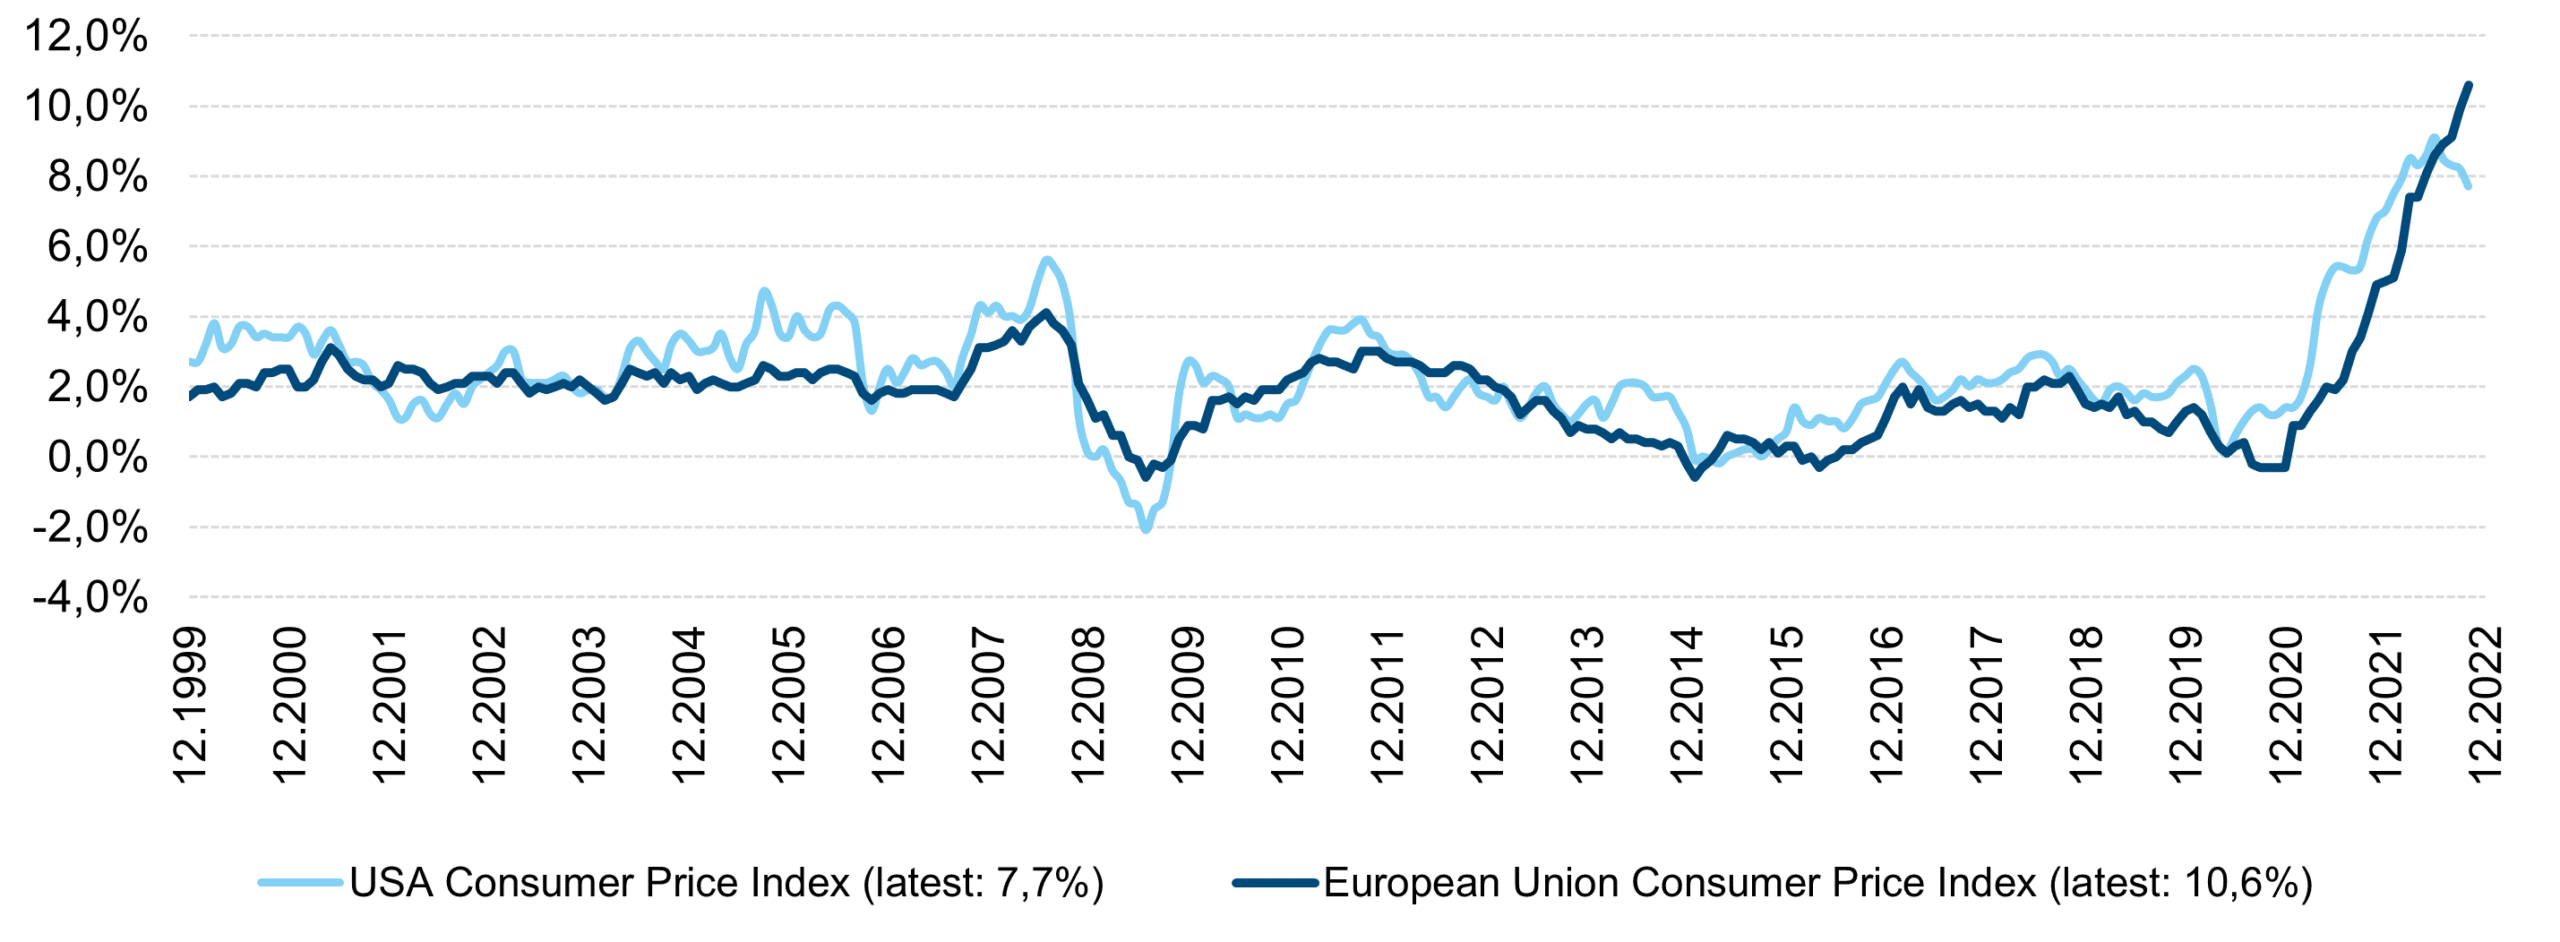
Consumer prices Europe, USA
Note: Past performance is not a reliable indicator for future performance.
Inflation has been the dominant topic since it “launched” at the end of 2020. Sharply rising prices for products and services lead to reduced purchasing power and uncertainty among consumers. Wage and salary negotiations are becoming controversial. At the same time, high inflation triggers a strong reaction from the central banks: they try to keep inflation expectations for the future within a narrow bandwidth by raising interest rates and using succinct rhetoric. This is to prevent so-called secondary effects.
In the above chart depicting consumer prices, two things are particularly interesting:
- For the time being, consumer prices in the USA have probably gone past their peak momentum. While the figures in Europe do not reflect this now, there is much to suggest that Europe is following the USA here.
- Europe has had almost a decade of low inflation (2010 to 2019). The issue of inflation seemed to have almost disappeared from public perception, only to return all the more unpleasantly and suddenly.
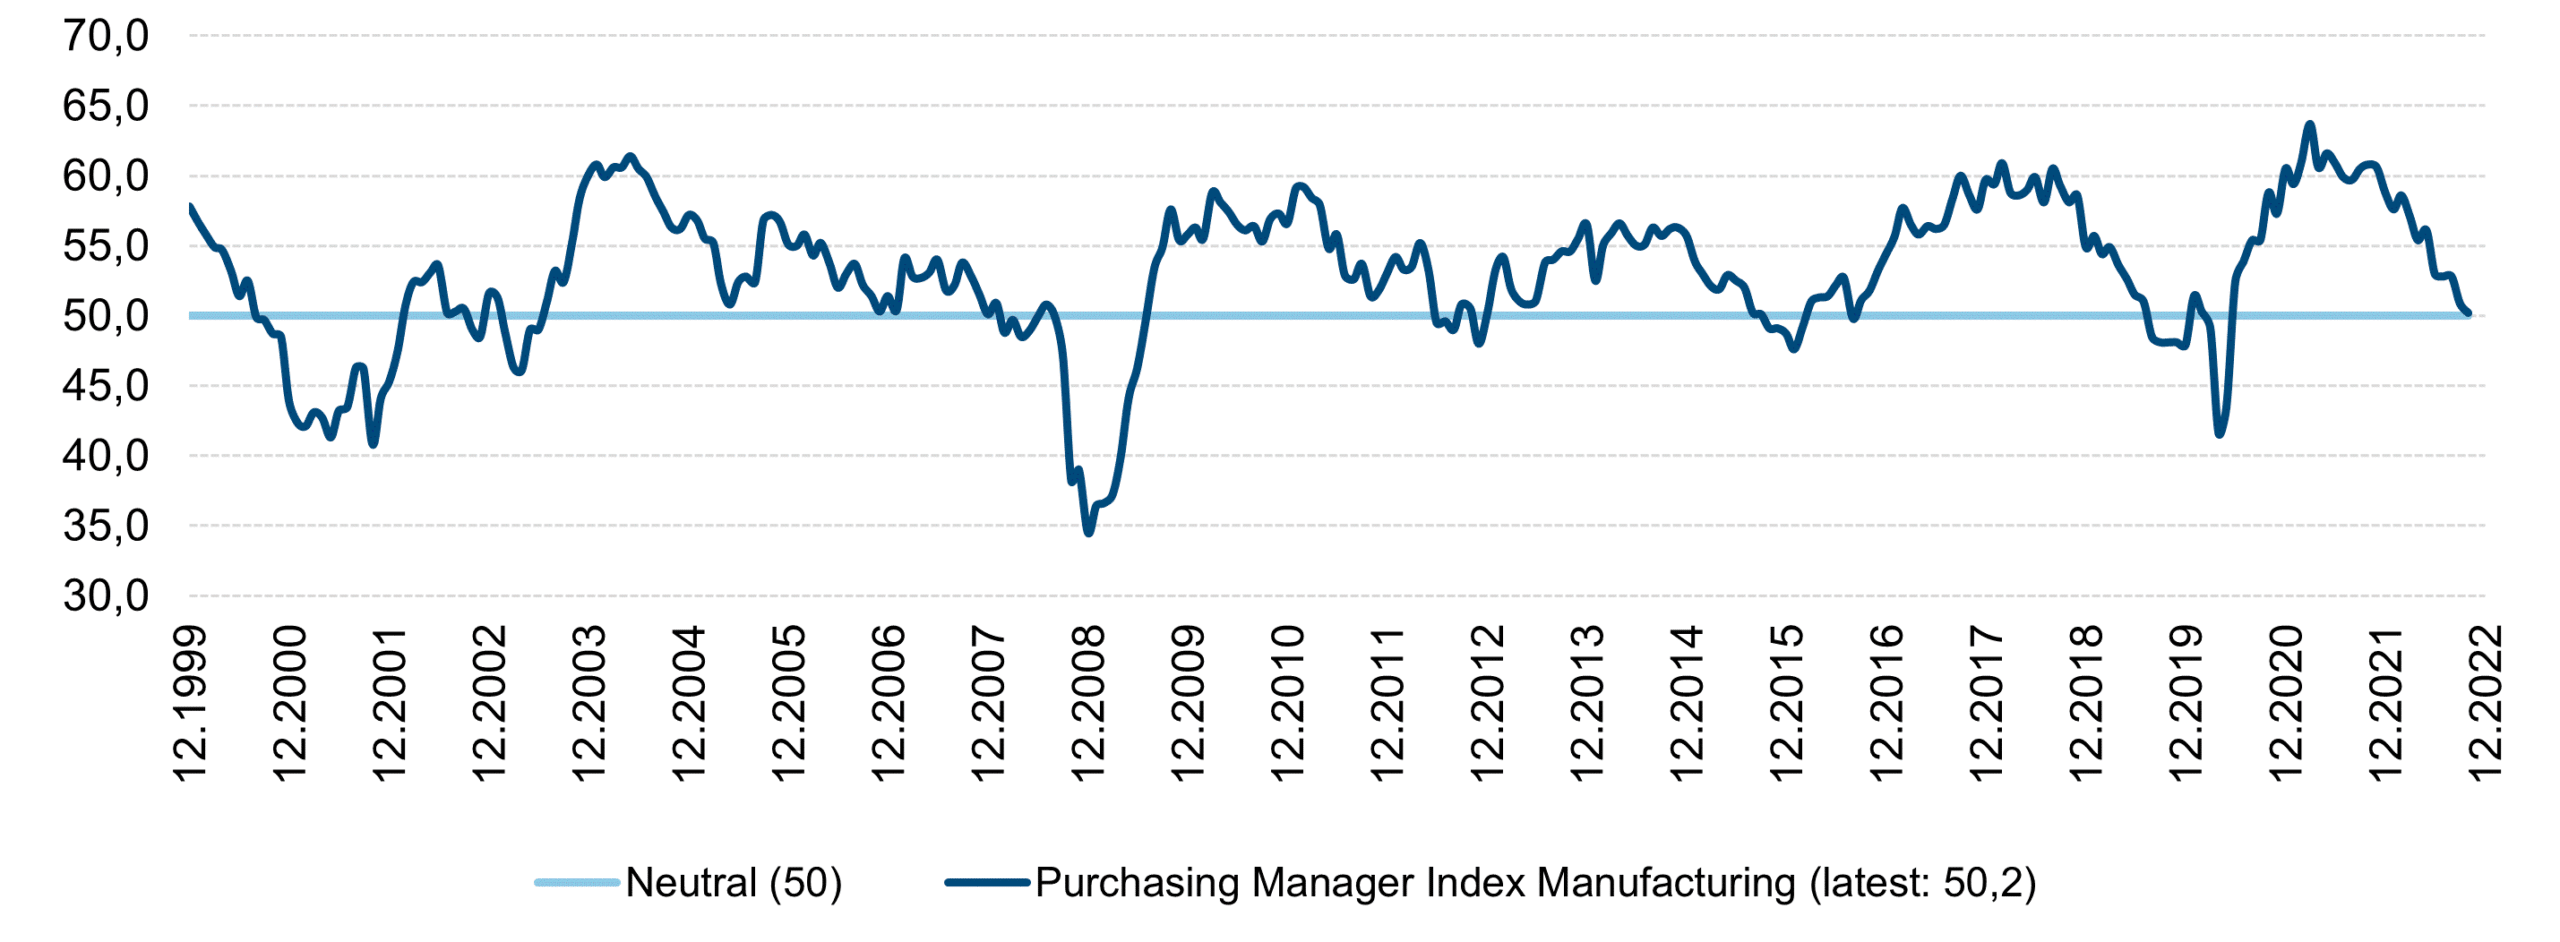
Purchasing managers’ index
Note: Past performance is not a reliable indicator for future performance.
The purchasing managers’ index (PMI) is one of the most recognised and widely followed descriptors of the state of the economy. This index is available for the most important countries. For this, people who make decisions in large companies about purchasing, merchandise management, and cooperation with suppliers are presented with a well thought-out catalogue of questions, optimised over time. They know a lot about the situation in their own company and how things are going in the industry and in the economy in general. Due to the importance of the PMI, the questionnaire is not filled out “on the side”, but professionally and in a serious manner. Variables include production output, new regional orders and those for export, supplier response times and supply chains, inventory levels, etc. Corresponding variables are used for the service sector.
A value above 50 means an expanding economy, and a value below 50 means a contracting economy. The chart shows two things in particular:
- The cyclicality of an economy over the decades. In the best case, an economy grows by the extent of its potential: that is, without having to release employees and machines, but also without overburdening them.
- The latest available value shows that the PMI – here for the USA; the USA is trend-setting for the global economy – is right at the neutral value of 50, and thus, after weakening for about twelve months, is now in “no man’s land” between further deterioration and improvement.
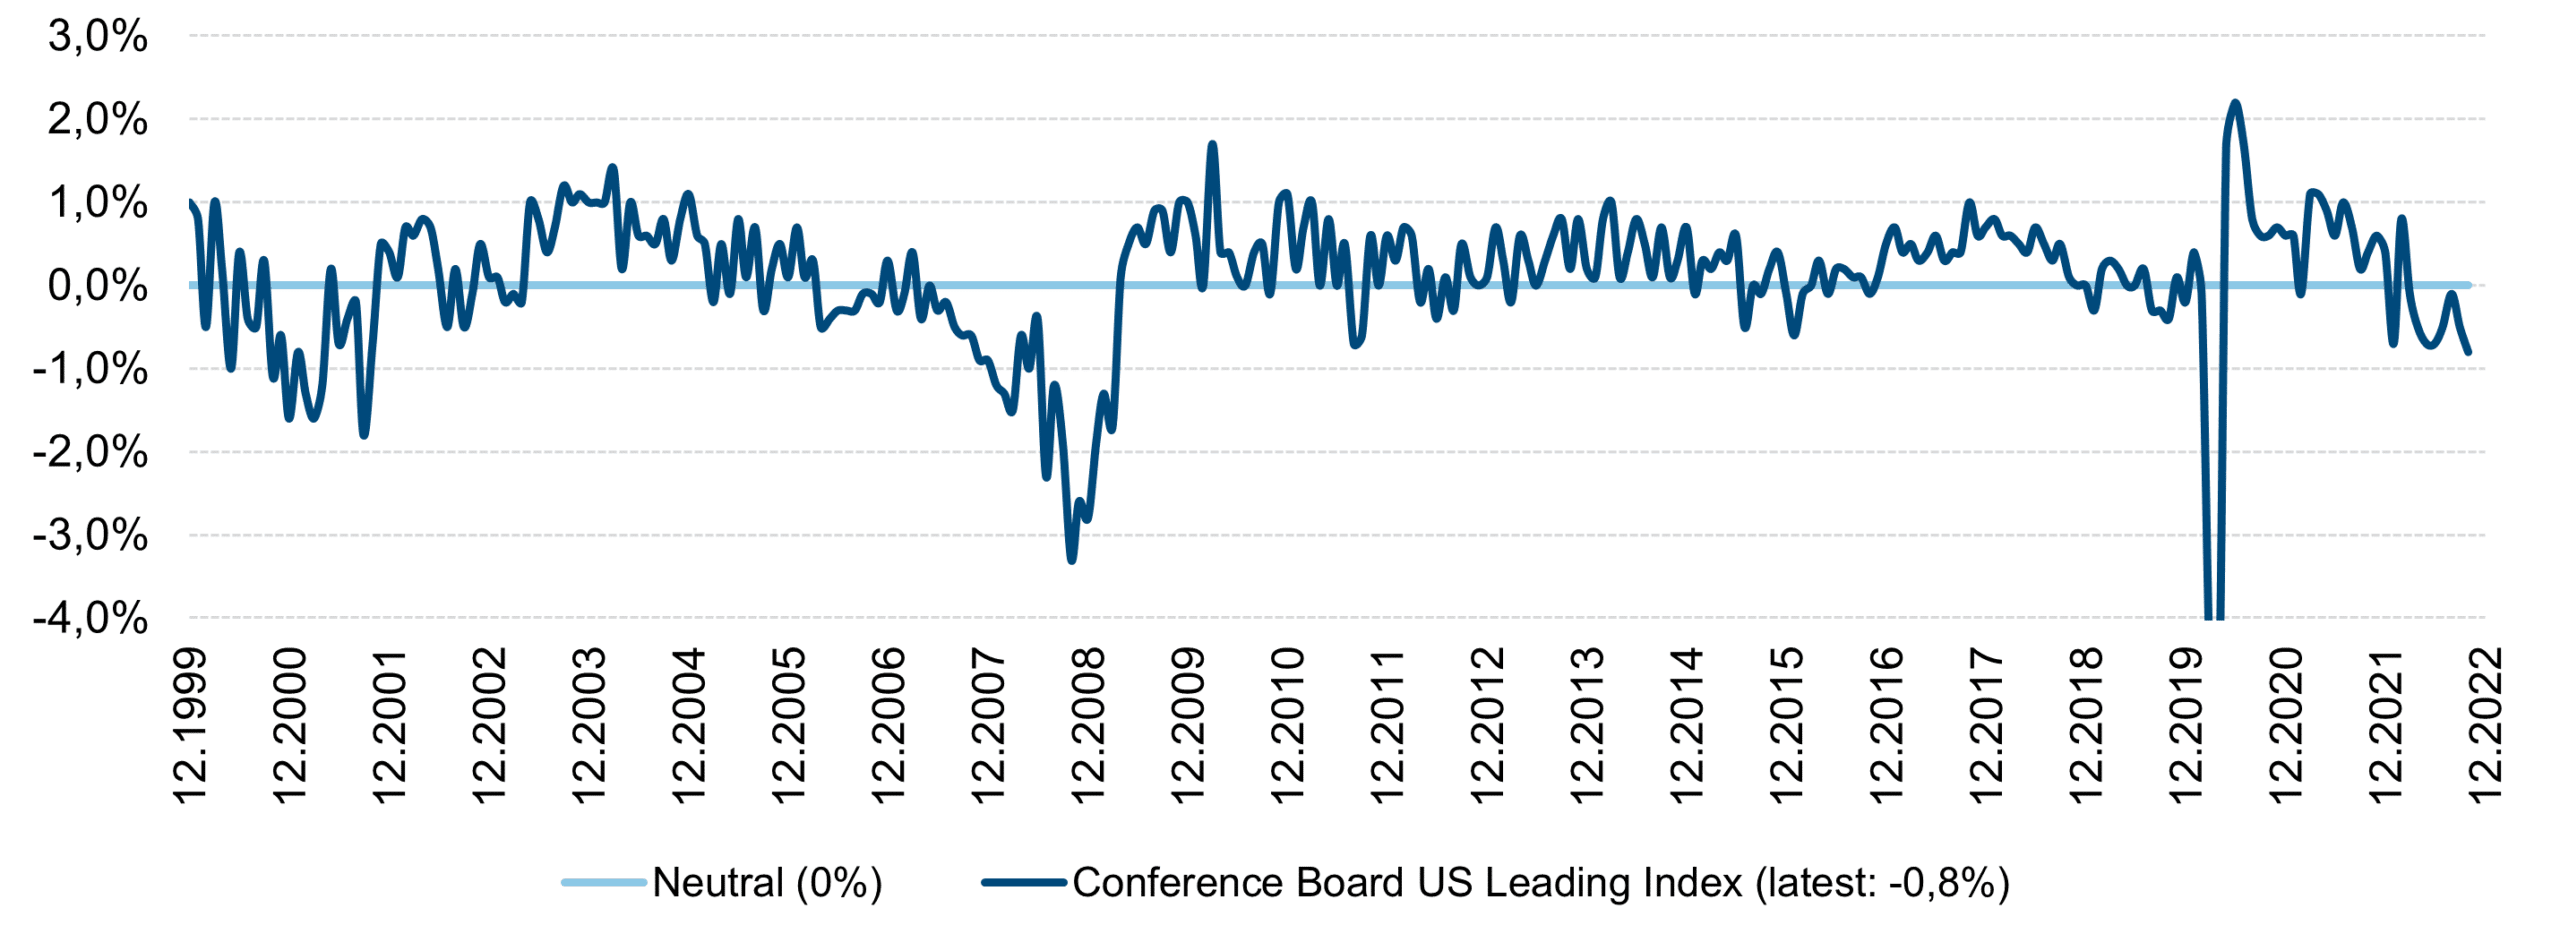
Leading economic indicator
Note: Past performance is not a reliable indicator for future performance.
So-called leading indicators are important in the management of investments. Forecasts about the future are meaningful despite their inherent uncertainty. After all, one wants to quantify what the future could hold. The Conference Board is a long-standing non-competitive institution in the USA. Its goal is to aggregate observable parameters of economic events in a way that facilitates not only a description of the current state but also a forward-looking statement. For the Conference Board Leading index, variables are combined that provide a segmented insight in order to make a reliable statement. These include consumer expectations, lending and credit quality, order books, but also leading stock market indices for equities and bonds, and more. As a result, this chart has a good track record, for example in terms of gross domestic product (GDP). The index has been very reliable in the forecasting of the overall economic performance of a country, which is only available for actual numbers with a strong time lag. What is the current status? The reading has fallen for eight months in a row. Thus, it clearly forecasts a recession in the USA.
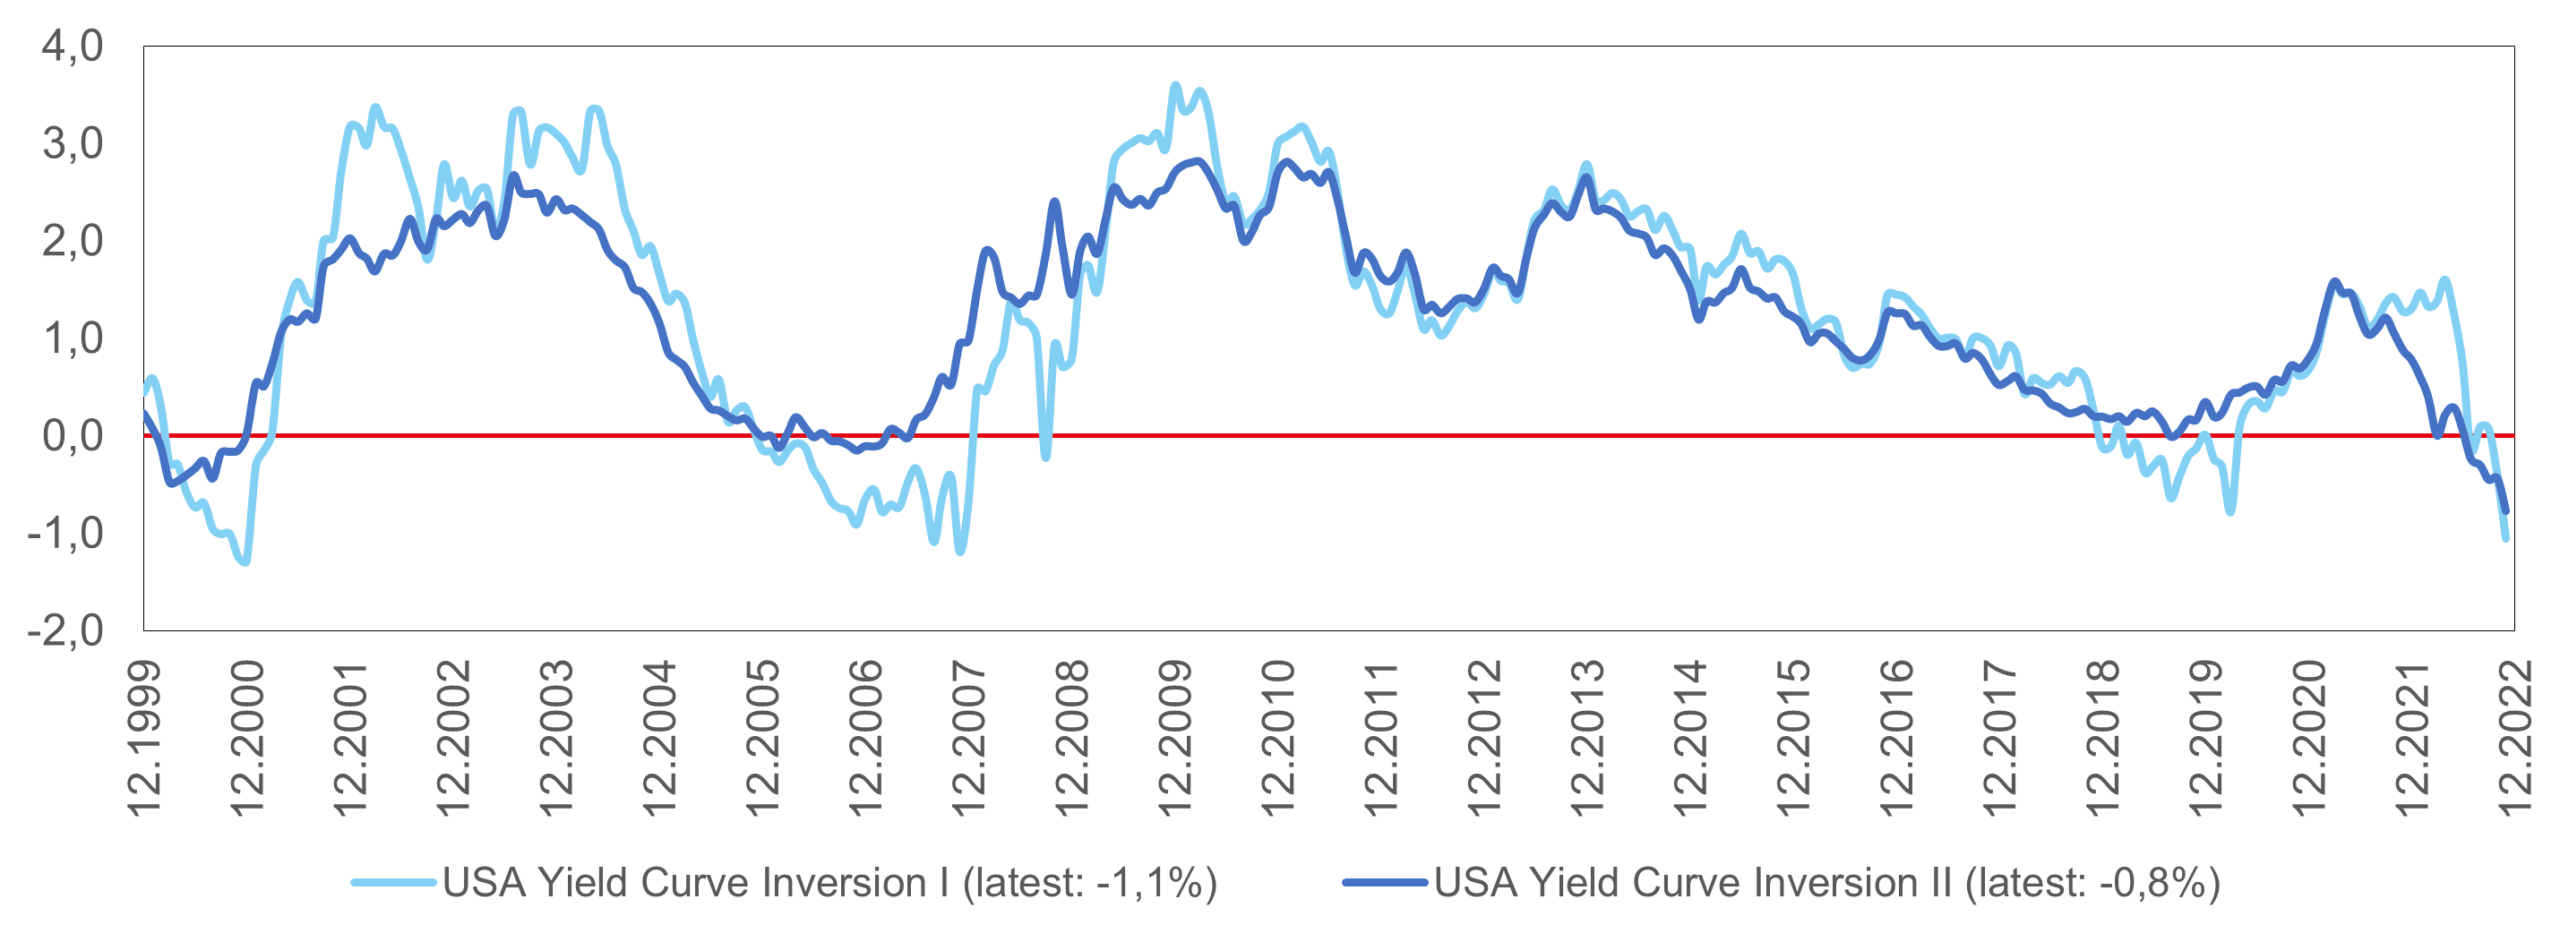
Development of the yield curve
Note: Past performance is not a reliable indicator for future performance.
The yield curve reflects the rate of return in the fixed-income area that can be achieved from an investment at a certain point in time over different periods of time. Returns for a short investment, for example three months (3M), should be lower on the yield curve than for a long investment, for example ten years (10Y). The chart shows the difference between the two. If the line is rising or high, the investment is rewarded for a longer period: the future is seen as particularly positive. If the line is falling, this means a decreasing premium for investments in the future, in favour of investments with a short time horizon: the future is assessed as uncertain. Two methods are commonly used for the calculation, namely the comparison of 2Yand 10Y, and the comparison of 3M and 10Y. Both variants are plotted in the chart – both statements are comparable.
Only in rare cases is the red line on the chart broken at all or for a longer period: a negative value implies that the economic environment “punishes” a prolonged commitment to investments. In the USA, we entered this scenario in mid-2022 – and it has prevailed ever since. A signal that was previously considered a harbinger of recession. However, the number of events is small, as the chart shows, and we can therefore not derive a 100% accuracy of this statement from the past.
Long-term interest rates
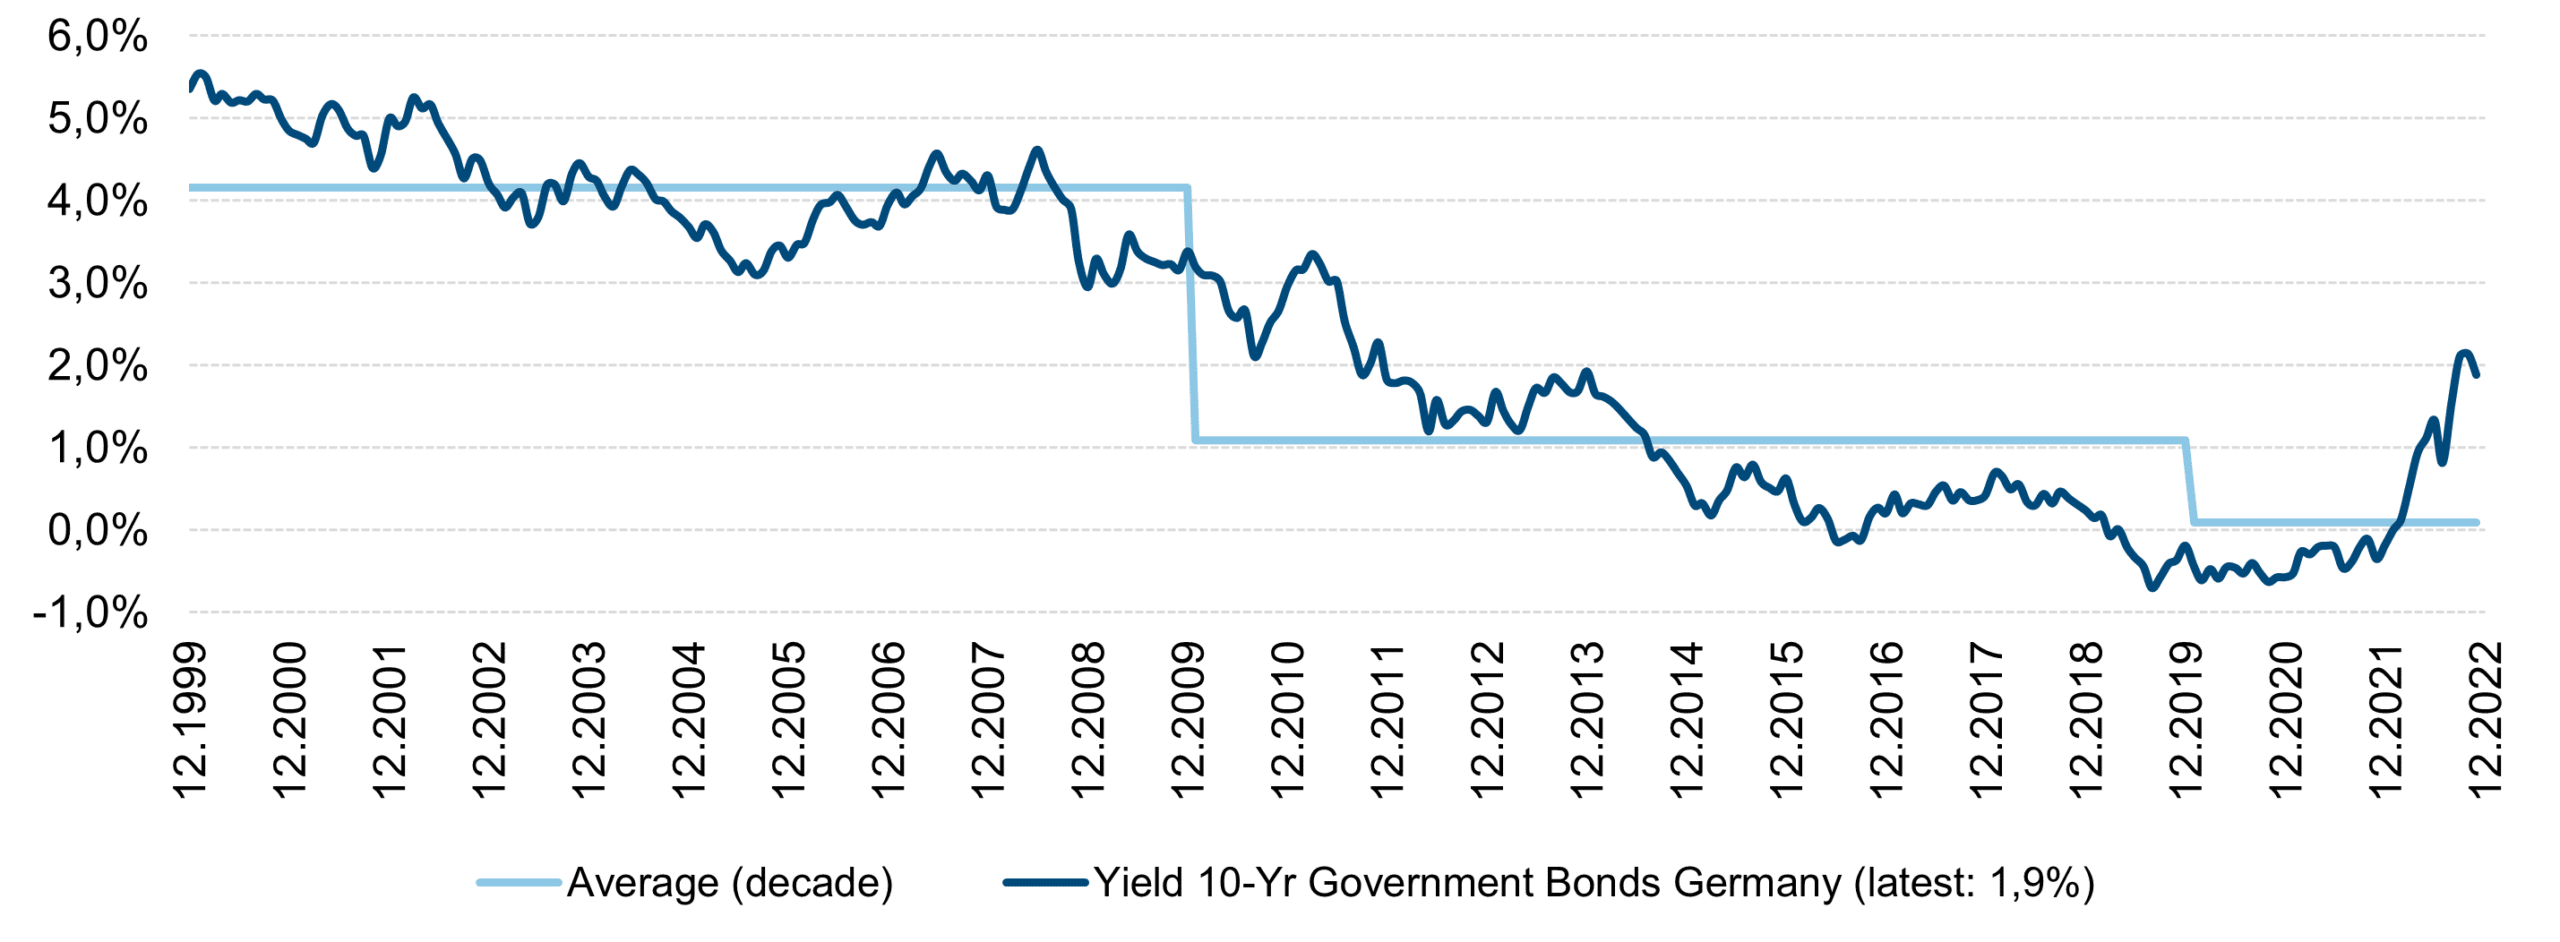
Note: Past performance is not a reliable indicator for future performance.
The term bond yield describes the interest investors receive when they make their capital available to a government or company in the form of bonds for a limited period of time. Government and corporate bonds are primarily held by institutional investors such as pension funds. Retail investors are also becoming increasingly interested in interest-bearing assets.
The chart above reflects the falling interest rates, which had been more or less a given in Europe and the USA for decades – until the situation changed this year. On the eve of the “Great Financial Crisis” in 2008, interest rates were still in the 4%-5% range. Interest rates at that level were also available on savings accounts at the time. These rates came down significantly in the following decade, remaining low to stimulate the economy. Low interest rates make capital more readily available.
This was followed by the euro crisis in 2015/16 for Europe and the Covid crisis in 2020 for the entire world: they prohibited interest rates from going anywhere near the level of pre-2008. In the end, inflation made interest rate hikes and thus applying the brakes unavoidable, despite the fact that in Europe interest rate hikes have to be weighed very carefully due to regional differences. In Europe, inflation is mainly driven by energy prices. They can only be influenced to a limited extent by central bank measures.
Share prices and company earnings
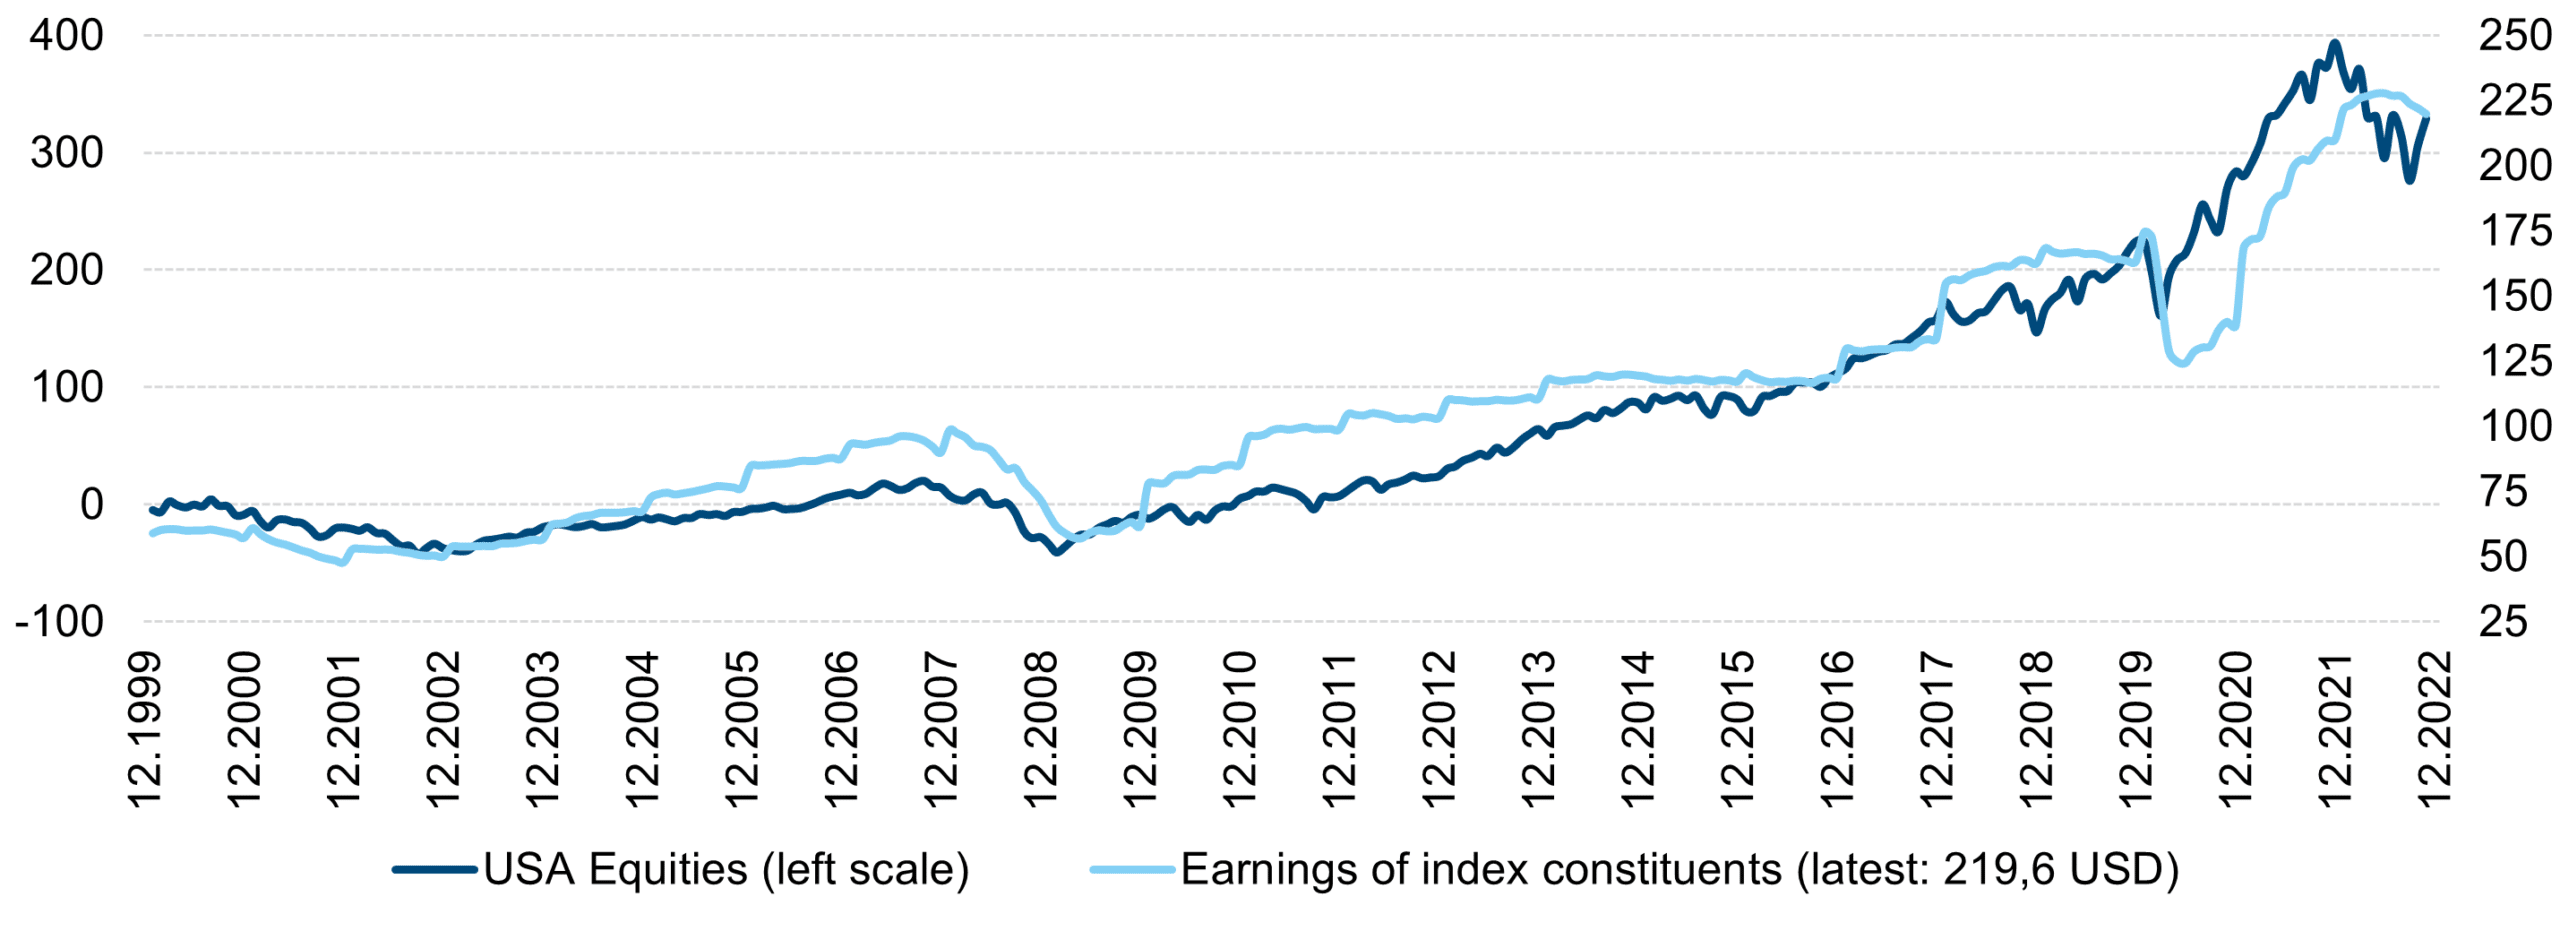
Note: Past performance is not a reliable indicator for future performance.
Share prices are often seen with a high degree of uncertainty and associated with unpredictable behaviour. Nevertheless, they ultimately are reliable indicators of the profits (also referred to as earnings) of companies – even if not always in a timely manner. The chart shown illustrates the most important US equity index. The USA is by far the most important global equity market, with two thirds of the capital invested worldwide held in US companies.
The steady earnings growth in the period under review is interesting. It was only temporarily interrupted by the 2020 Covid crisis. This growth underpins the decision of investors to invest permanently in the stock market to make their savings work for them. Time is clearly on their side. Trying to improve returns through entry and exit is possible. In the majority of cases, the constant “in and out” does, however, not yield any sustainable surplus return.
Currently, earnings growth has slowed, but not sharply. A recession in the USA could speed up this development. But this does not have to be the case if what we are seeing is a so-called technical recession: while such a recession does trigger the expected economic parameters, company earnings are not negatively affected, at least not in a noticeable way.
Commodity prices
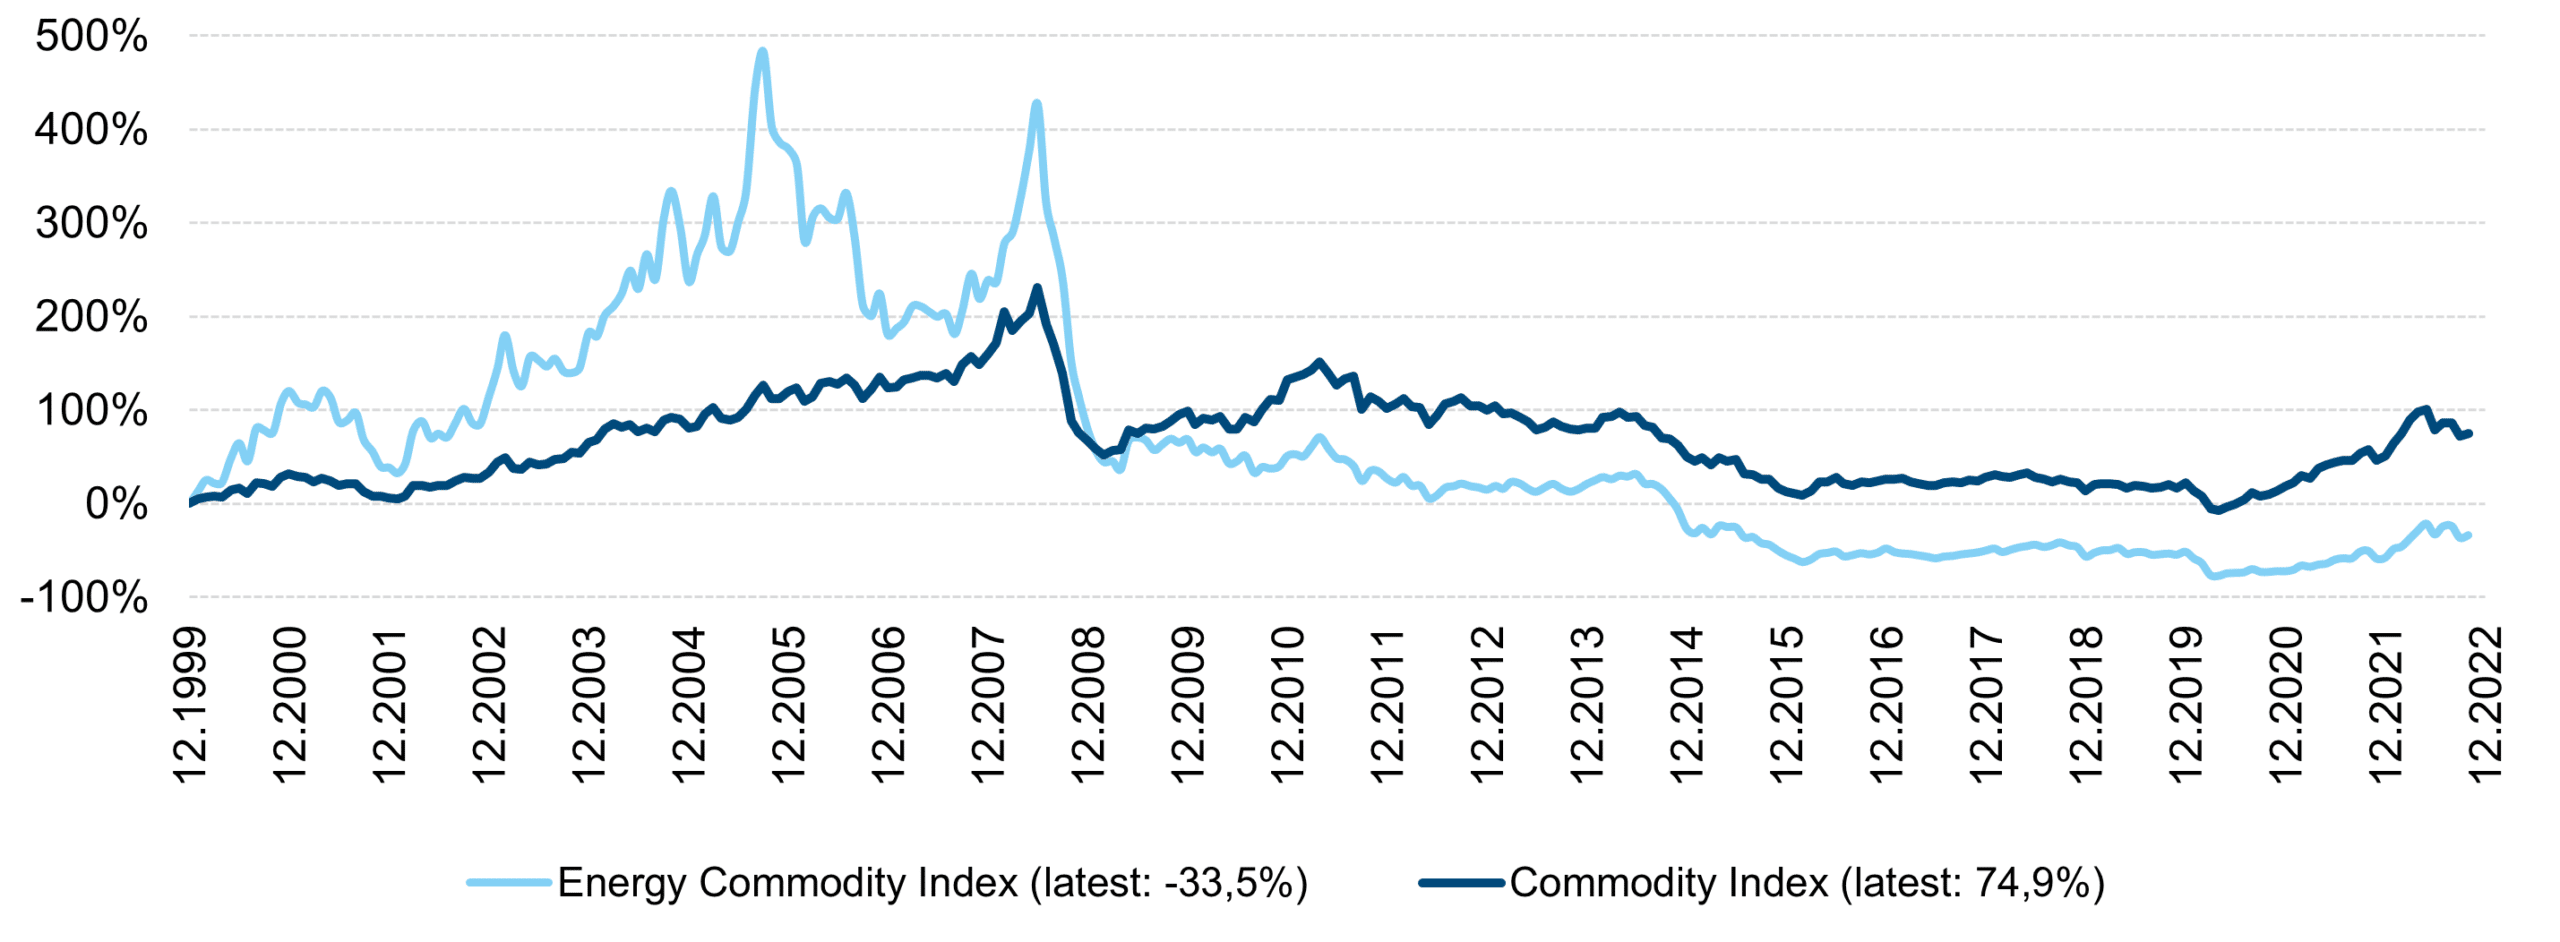
Note: Past performance is not a reliable indicator for future performance.
Commodity indices are mostly composed of the following groups of commodities: energy (crude oil, oil products such as petrol, diesel and heating oil, as well as natural gas), industrial metals (such as copper, nickel, and aluminium), precious metals (primarily gold and silver) and agricultural commodities or food (N.B. we as asset managers have excluded the food sector).
This chart provides a view of the commodity markets from the perspective of a financial investor. Here, an investment is only feasible via derivative instruments, so-called futures. This is because financial investors cannot store commodities after a purchase. The chart shows an interesting phase: we were being spoiled by low, stable energy prices for about a decade on a global scale. In the past two years, however, prices have risen sharply. Even in this time frame, the fluctuations are at most similar or even weaker compared to those before 2008. It should be mentioned that energy prices in Europe, which are much more strongly related to the Ukraine war than those in the USA, are not reflected in the usual commodity indices. This chart therefore does not adequately express the pressure with which a European household has to deal.
At the same time, commodities are a market in which supply and demand usually find a balance in the long run: increased demand leads to more production and extraction and vice versa. Commodity and equity charts differ from each other. In the past, equity charts have recorded a stable increase, whereas for commodities by and large, strong phases are followed by weak ones.
Conclusion
Economic indicators are meant to provide as reliable a picture of the economy as possible and are directly incorporated into investment decisions. Generally, indicators look at the past, the present state, or the future They are illustrated by charts (graphs).
The current statement that can be read from the aforementioned graphs is ambivalent: the boom phase of the economy in the aftermath of the Covid crisis is over. We are now dealing with inflation on a highly undesirable scale. Central banks are fighting inflation with interest rate hikes and expectations management. The need to fight inflation means that a temporary, moderate slowdown in the US and European economies could lead them to slide into recession in 2023 – with corresponding consequences for the global economy. At the same time, this recession could be moderate or lead to stock market turbulence. Charts can help to visually perceive and classify changes over time.
For a glossary of technical terms, please visit this link: Fund Glossary | Erste Asset Management
Legal note:
Prognoses are no reliable indicator for future performance.
Legal disclaimer
This document is an advertisement. Unless indicated otherwise, source: Erste Asset Management GmbH. The language of communication of the sales offices is German and the languages of communication of the Management Company also include English.
The prospectus for UCITS funds (including any amendments) is prepared and published in accordance with the provisions of the InvFG 2011 as amended. Information for Investors pursuant to § 21 AIFMG is prepared for the alternative investment funds (AIF) administered by Erste Asset Management GmbH pursuant to the provisions of the AIFMG in conjunction with the InvFG 2011.
The currently valid versions of the prospectus, the Information for Investors pursuant to § 21 AIFMG, and the key information document can be found on the website www.erste-am.com under “Mandatory publications” and can be obtained free of charge by interested investors at the offices of the Management Company and at the offices of the depositary bank. The exact date of the most recent publication of the prospectus, the languages in which the fund prospectus or the Information for Investors pursuant to Art 21 AIFMG and the key information document are available, and any other locations where the documents can be obtained are indicated on the website www.erste-am.com. A summary of the investor rights is available in German and English on the website www.erste-am.com/investor-rights and can also be obtained from the Management Company.
The Management Company can decide to suspend the provisions it has taken for the sale of unit certificates in other countries in accordance with the regulatory requirements.
Note: You are about to purchase a product that may be difficult to understand. We recommend that you read the indicated fund documents before making an investment decision. In addition to the locations listed above, you can obtain these documents free of charge at the offices of the referring Sparkassen bank and the offices of Erste Bank der oesterreichischen Sparkassen AG. You can also access these documents electronically at www.erste-am.com.
Our analyses and conclusions are general in nature and do not take into account the individual characteristics of our investors in terms of earnings, taxation, experience and knowledge, investment objective, financial position, capacity for loss, and risk tolerance. Past performance is not a reliable indicator of the future performance of a fund.
Please note: Investments in securities entail risks in addition to the opportunities presented here. The value of units and their earnings can rise and fall. Changes in exchange rates can also have a positive or negative effect on the value of an investment. For this reason, you may receive less than your originally invested amount when you redeem your units. Persons who are interested in purchasing units in investment funds are advised to read the current fund prospectus(es) and the Information for Investors pursuant to § 21 AIFMG, especially the risk notices they contain, before making an investment decision. If the fund currency is different than the investor’s home currency, changes in the relevant exchange rate can positively or negatively influence the value of the investment and the amount of the costs associated with the fund in the home currency.
We are not permitted to directly or indirectly offer, sell, transfer, or deliver this financial product to natural or legal persons whose place of residence or domicile is located in a country where this is legally prohibited. In this case, we may not provide any product information, either.
Please consult the corresponding information in the fund prospectus and the Information for Investors pursuant to § 21 AIFMG for restrictions on the sale of the fund to American or Russian citizens.
It is expressly noted that this communication does not provide any investment recommendations, but only expresses our current market assessment. Thus, this communication is not a substitute for investment advice.
This document does not represent a sales activity of the Management Company and therefore may not be construed as an offer for the purchase or sale of financial or investment instruments.
Erste Asset Management GmbH is affiliated with the Erste Bank and austrian Sparkassen banks.
Please also read the “Information about us and our securities services” published by your bank.