
…and go away, but remember to come back in September.
– this is an old stock market adage that most investors probably know. There are loads of those, and this is among the most popular ones. It refers to a capital market anomaly that claims that from May to August, the rate of return that can be achieved on the equity market is below average, whereas from September to April, above-average rates can be earned.
Does this “May effect” hold up to empirical scrutiny? We have had a look at the recent past from the perspective of a euro investor in order to assess the truth content of this adage.
May effect – comparative performances
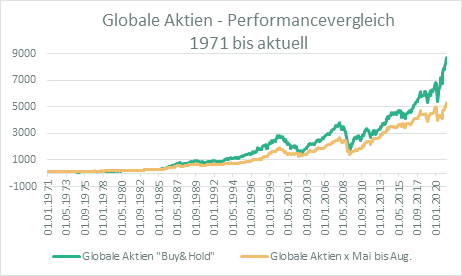
We base our analysis of the May effect on two euro investors (or prior to 1999, deutschemark investors) who invested EUR 100 in global equities in January 1971. Whereas investor 1 (INV1) pursues a buy-and-hold strategy, investor 2 (INV2) would have always sold his equity portfolio in May and bought it back in September. If the stock market adage of “sell in May” holds true, we can expect INV2 to have come out on top
. However, as it turns out, the opposite is the case. Our fictitious INV1 had grown his portfolio to a respectable EUR 8,675 by the end of April 2021, while INV2 was only holding equities worth EUR 5,285. In terms of yields, the difference looks less dramatic at first glance, but given the compounding effect the first glance is not what counts. INV1 achieved an annual return of 9.3%, while INV2 generated an annual 8.2% return on investment (or on a monthly basis, 0.83% for INV1 and 0.73% for INV2, on average). This simple model suggests that the validity of the aforementioned stock market adage has to be rejected.
Sources: Bloomberg, own calculations
May effect from a risk perspective
Of course, one could argue that INV2 may have taken less risk in his investments by avoiding the possibly volatile months of May to August. At first glance, this suggestion can actually be substantiated. While INV1’s annual volatility was 14.8%, INV2’s portfolio was only subject to 12.7%. But what about relative risk? Which of the two investors reaped a higher reward per unit of risk he assumed over time? This question can be answered by looking at the Sharpe ratio, which allows for the comparison of historical performance of investments while taking into account risk. And we see that with a Sharpe ratio of 0.37x, INV1 is has beaten INV2 (0.34x) to it again. We can therefore say that the risk assumed by the two investors reaped a higher reward for the buy-and-hold strategy than for the strategy that would try to avoid the May effect.
The May effect over time
Having found out that there has been no aggregate May effect over the past 50 years, we now want to look more closely at the sub-periods. After all, it may well be that there has been a May effect in the past but that it has dissipated in the meantime. Also, the May effect might exist, but it may have been diluted in the long-term analysis by some positive outliers.
In order to get to the bottom of this question, we segmented the observation period into periods of ten years each. As the following table suggests, the stock market adage was indeed valid in the 1970 and 2000s. In those decades, INV2’s portfolio outperformed INV1’s portfolio. Those were difficult times for equity investments overall; the 70s were dominated by oil shocks and economic crises, while in the first decade of the new millennium, the bursting of the tech bubble was followed by the financial crisis. In such an environment, investors were able to achieve higher annual returns (1970s: 0.73%; 2000s: 0.69%) by avoiding the months of May to August. In the other three decades of the observation period (please refer to the table below), the holding strategy would have been preferable.
| Perf. p.a. buy & hold | Perf. p.a. without May-August | Difference p.a. | |
| 1970s | 6.17% | 6.90% | -0.73% |
| 1980s | 17.51% | 13.45% | 4.06% |
| 1990s | 11.30% | 9.91% | 1.39% |
| 2000s | 1.70% | 2.39% | -0.69% |
| 2010s | 9.51% | 7.83% | 1.68% |
Sources: Bloomberg; own calculations
A detailed look at the individual months
Next, let us have a detailed look at the individual months of the year. As the following chart illustrates, the average performance over the years of August is indeed negative, but only marginally so. While May and June tend to underperform, at least they are positive. July, on the other hand, exceeds the average across all months. This explains why INV2 came in second: since he does not invest from May to August, he misses out on three months of positive performance on average. Only avoiding August has had a slightly positive effect on his performance in the past 50 years.
Sources: Bloomberg; own calculations
May effect – a subjective experience
There is, however, an above-average prevalence of negative months during late spring and summer; this is particularly true for June, which has been negative half of the times in the past 50 observations. May, July, and August also account for above-average shares of negative monthly returns relative to most other months of the year. While on average 37.6% of months have resulted in negative rates of return for the investor historically, that percentage increases to above 40% for the months affected by the May effect. This means the stock market adage may be the result of a subjective experience. In terms of absolute numbers, these months yield a negative performance an above-average amount of times, but the positive years more than make up for them.
Sources: Bloomberg; own calculations
Negative trends would cluster around the period of May to August. Overall, we have noticed 19 periods of more than four months of falling share prices in the past 50 years on a rolling basis. Four thereof (i.e. 21%) occurred during the aforementioned period. In further six corrections (32%), at least three of the respective months were involved (1x April to July, 5x June to August). This means that on aggregate, some 53% of these negative trend phases occurred (largely) during the summer months – another reason why this stock market adage may have established itself. But we should not forget that such profound periods of weakness occur only very rarely and make up only about 3% of all rolling four-month observations in the past 50 years. This means it seems to be yet again due to subjective experience that this adage according to which investors should be particularly cautious about the months of May to August on the equity markets keeps making its rounds.
Sources: Bloomberg; own calculations
Weak September
The aggregate of data available does not actually suggest returning to the market in September – quite in contrast to the adage. In fact, if you wanted to steer clear of a month, September would be the one. Alongside August, September is the only negative month on average, and significantly so (-0.53%) over the past 50 years. At 42%, the number of negative return observations in September is also above average. In addition, the month of September was involved in 37% of all negative trend phases (i.e. four negative months in a row).
Therefore, we now add a third investor (INV3) to our model, who is invested in global equities over the entire observation period but always sells his equity portfolio on 31 August and re-invests on 30 September. As it turns out, INV3, achieving 9.97% p.a., would actually beat the buy-and-hold strategy of INV1 (9.27%) – and at a lower volatility to boot (14% vs. 14.8%). This also leads to a better Sharpe ratio relative to the buy-and-hold strategy of 0.43x vs 0.36x.
These are of course all theoretical musings, because in real life, the improved performance achieved by avoiding September is often not enough to offset transaction costs and thus create added value.
Conclusion
We have to reject the hypothesis (i.e. old stock market adage) according to which it pays off to abstain from the market fully or partially from May to the end of August on empirical grounds. While some of these months are associated with below-average performance rates and above-average numbers of negative returns in a multi-year analysis, the performance over the summer months in the recent 50 years has been positive, which means it also contributed positively to the overall performance.
Legal note:
Prognoses are no reliable indicator for future performance.
Legal disclaimer
This document is an advertisement. Unless indicated otherwise, source: Erste Asset Management GmbH. The language of communication of the sales offices is German and the languages of communication of the Management Company also include English.
The prospectus for UCITS funds (including any amendments) is prepared and published in accordance with the provisions of the InvFG 2011 as amended. Information for Investors pursuant to § 21 AIFMG is prepared for the alternative investment funds (AIF) administered by Erste Asset Management GmbH pursuant to the provisions of the AIFMG in conjunction with the InvFG 2011.
The currently valid versions of the prospectus, the Information for Investors pursuant to § 21 AIFMG, and the key information document can be found on the website www.erste-am.com under “Mandatory publications” and can be obtained free of charge by interested investors at the offices of the Management Company and at the offices of the depositary bank. The exact date of the most recent publication of the prospectus, the languages in which the fund prospectus or the Information for Investors pursuant to Art 21 AIFMG and the key information document are available, and any other locations where the documents can be obtained are indicated on the website www.erste-am.com. A summary of the investor rights is available in German and English on the website www.erste-am.com/investor-rights and can also be obtained from the Management Company.
The Management Company can decide to suspend the provisions it has taken for the sale of unit certificates in other countries in accordance with the regulatory requirements.
Note: You are about to purchase a product that may be difficult to understand. We recommend that you read the indicated fund documents before making an investment decision. In addition to the locations listed above, you can obtain these documents free of charge at the offices of the referring Sparkassen bank and the offices of Erste Bank der oesterreichischen Sparkassen AG. You can also access these documents electronically at www.erste-am.com.
Our analyses and conclusions are general in nature and do not take into account the individual characteristics of our investors in terms of earnings, taxation, experience and knowledge, investment objective, financial position, capacity for loss, and risk tolerance. Past performance is not a reliable indicator of the future performance of a fund.
Please note: Investments in securities entail risks in addition to the opportunities presented here. The value of units and their earnings can rise and fall. Changes in exchange rates can also have a positive or negative effect on the value of an investment. For this reason, you may receive less than your originally invested amount when you redeem your units. Persons who are interested in purchasing units in investment funds are advised to read the current fund prospectus(es) and the Information for Investors pursuant to § 21 AIFMG, especially the risk notices they contain, before making an investment decision. If the fund currency is different than the investor’s home currency, changes in the relevant exchange rate can positively or negatively influence the value of the investment and the amount of the costs associated with the fund in the home currency.
We are not permitted to directly or indirectly offer, sell, transfer, or deliver this financial product to natural or legal persons whose place of residence or domicile is located in a country where this is legally prohibited. In this case, we may not provide any product information, either.
Please consult the corresponding information in the fund prospectus and the Information for Investors pursuant to § 21 AIFMG for restrictions on the sale of the fund to American or Russian citizens.
It is expressly noted that this communication does not provide any investment recommendations, but only expresses our current market assessment. Thus, this communication is not a substitute for investment advice.
This document does not represent a sales activity of the Management Company and therefore may not be construed as an offer for the purchase or sale of financial or investment instruments.
Erste Asset Management GmbH is affiliated with the Erste Bank and austrian Sparkassen banks.
Please also read the “Information about us and our securities services” published by your bank.
More on the topic

Investment View | February 2025
What’s happening on the markets? In our Investment View, the experts of our Investment Division regularly provide insights of current market events and their opinion on the various asset classes.