
Among the best-known rights of a shareholder are the right to participate at the Annual General Meeting (AGM), the right to vote, and the right to a dividend. But who really attends an AGM?
Shareholders have seen great rates of return in recent years. Short set-backs were often used as opportunity to invest along the lines of “buying the dip”. In the USA, a new generation of investors has emerged, the Robin Hoods – named after the online broker Robin Hood, where shares can be bought at low (or sometimes no) fees.
These largely young and sometimes inexperienced investors have so far only ever seen rising markets. And how do you ideally navigate a rising market? – By buying everything that sounds good, regardless of the quality of the company and its products. In fact, the more speculative the business model, the higher the potential gains. If only it were that simple! Some of us remember the years 2001 to 2003 and 2008, when the global equity markets lost about 50% from their peaks to their lows; and, in contrast to the status quo: the more speculative the company, the bigger the losses. Having companies that pay dividends in one’s portfolio pays off in difficult years.
Value or Growth – what was hip?
The shares of companies with a good business model, well-known brands, a solid balance sheet, and attractive dividends are often referred to as Value shares. By contrast, the shares of companies that post high growth especially of sales and that are expected to turn profitable in the future are called Growth shares. Which of the two categories has fared better in the past ten years?
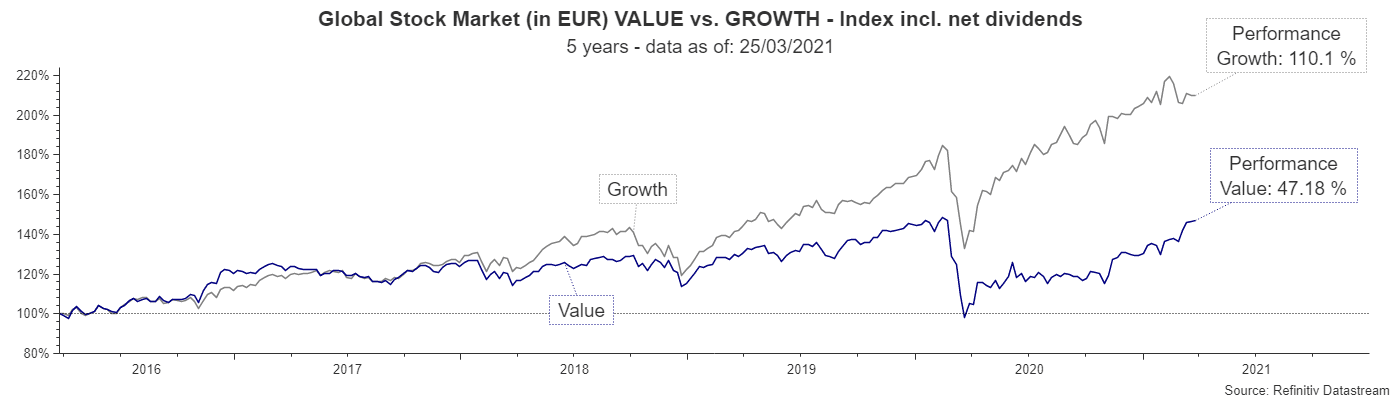
Chart 1: Global equity market Value vs. Growth 10Y, Performance in euro, net dividends taken into account, Source: Refinitiv Datastream, data as of 25 March 2021
A chart tends to say more than a thousand words. Some findings from the past ten years are obvious right away. Growth shares have clearly outperformed Value shares, recording twice their return (in euro, including dividend payments). While both market segments were neck-and-neck until 2016, the market has clearly favoured Growth in the recent five years. This could lead to the simplified conclusion that Growth is better than Value. But looking only at past performance can be treacherous. There is a reason why prospectuses state that “historical performance data of an investment are not indicative of its future development”.
All just a question of valuation?
Price-earnings ratio (PER)
There are numerous indicators that one can resort to in valuing equity markets. In the following, we will look at two in detail in order to be able to assess Value vs. Growth in more detail, i.e. the price-earnings ratio (PER) and the dividend yield.
Let us start with the PER and let us assume company A generates 5% profits in terms of its market capitalisation (price). The resulting PER is 100/5 = 20x. By comparison, company B only makes 2.5% worth of profit, which results in a PER of 100/2.5 = 40x. These ratios are not fictitious but are based on the actual valuation metrics of Value vs. Growth, as the following chart illustrates.
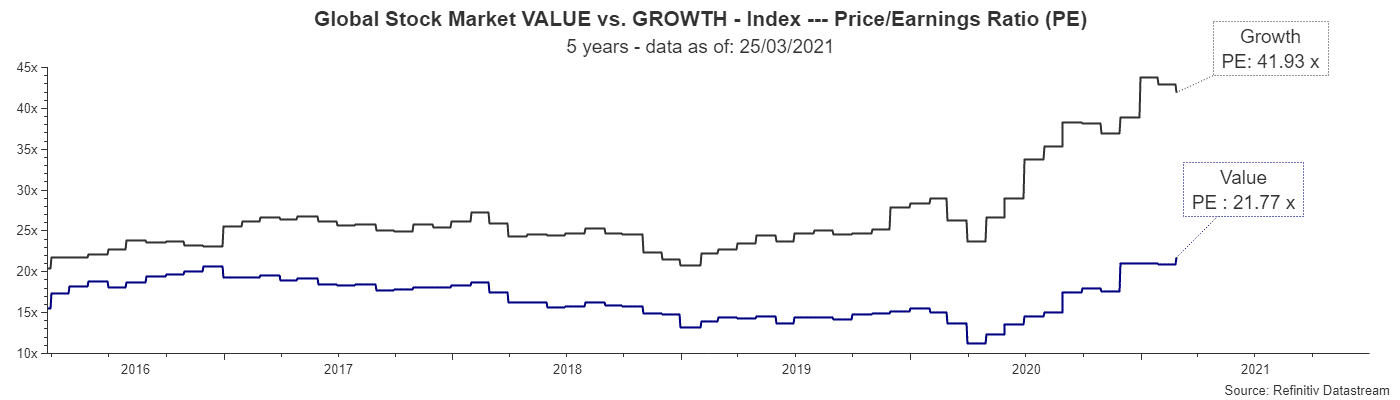
Chart 2: Global equity market Value vs. Growth PER 5Y, Source: Refinitiv Datastream, data as of 25 March 2021
The PER of the Value segment of the global equity market is currently at 21x, while at 42x, the PER of Growth is twice as high. The chart clearly highlights that this valuation gap has been widening in recent years. This means that Value commands a lower valuation, but also posts lower growth rates. Please note that the valuation of a company is not only based on the current profit (in the case of the current PER), but also profit expectations for the coming years.
The aforementioned comparison of both segments is based on a customary valuation ratio. But, excluding capital gains for a moment, what do investors get if they just hold their shares?
Dividend yield
Dividends are the reward for long-term shareholders. A high dividend can only be paid for the long run if company earnings are high as well. Let us look at Value and Growth on the basis of dividend yield.
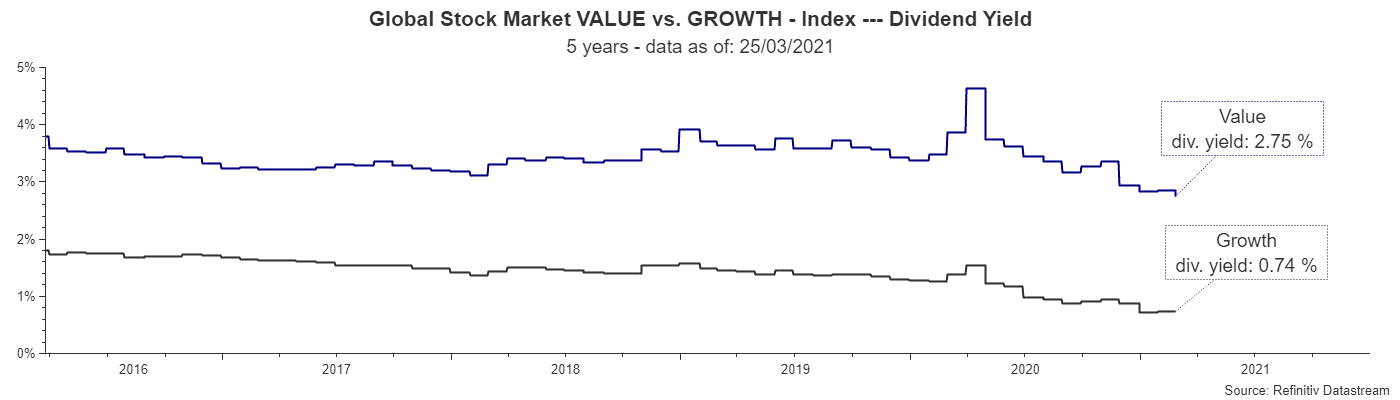
Chart 3: Global equity market Value vs. Growth, dividend yield 5Y, Source: Refinitiv Datastream, data as of 25 March 2021
At about 2.7%, the current dividend yield of Value is about four times that of Growth. Value companies often distribute a large part of their profits as dividends, whereas Growth companies plough them back and invest them into the expansion of their business.
Or do other factors play a role?
As we have seen above, Growth shares currently command significantly higher valuations than dividend (i.e. Value) shares. Investors have clearly preferred the former over the latter in recent years and have thus been able to ride a wave of outperformance. A growth rate of +50% or more makes for a better headline than a dividend of 2% or 3%.
What has history taught us?
- No trend lasts forever
- Sales and earnings growth are priced into the share prices years ahead and have to be supported by actual company results
After many years of rising prices, a lot of investors are mainly invested in Growth and the story behind it. In the wake of the corona crisis, many companies have had to cut or even suspend their dividend payments from March 2020 onwards. This gave a further relative boost to Growth, putting Value thoroughly out of fashion.
Conclusion
Dividend shares have been sidelined by investors in recent years. At the moment, however, their valuation is significantly more attractive than that of the Growth segment, making them worth a serious consideration.
By the way, to many investors, the origin of their dividends is important. They increasingly attach importance to whether the profits and thus dividends of the companies are coming from a sustainable business model.
Legal note:
Prognoses are no reliable indicator for future performance.
Legal disclaimer
This document is an advertisement. Unless indicated otherwise, source: Erste Asset Management GmbH. The language of communication of the sales offices is German and the languages of communication of the Management Company also include English.
The prospectus for UCITS funds (including any amendments) is prepared and published in accordance with the provisions of the InvFG 2011 as amended. Information for Investors pursuant to § 21 AIFMG is prepared for the alternative investment funds (AIF) administered by Erste Asset Management GmbH pursuant to the provisions of the AIFMG in conjunction with the InvFG 2011.
The currently valid versions of the prospectus, the Information for Investors pursuant to § 21 AIFMG, and the key information document can be found on the website www.erste-am.com under “Mandatory publications” and can be obtained free of charge by interested investors at the offices of the Management Company and at the offices of the depositary bank. The exact date of the most recent publication of the prospectus, the languages in which the fund prospectus or the Information for Investors pursuant to Art 21 AIFMG and the key information document are available, and any other locations where the documents can be obtained are indicated on the website www.erste-am.com. A summary of the investor rights is available in German and English on the website www.erste-am.com/investor-rights and can also be obtained from the Management Company.
The Management Company can decide to suspend the provisions it has taken for the sale of unit certificates in other countries in accordance with the regulatory requirements.
Note: You are about to purchase a product that may be difficult to understand. We recommend that you read the indicated fund documents before making an investment decision. In addition to the locations listed above, you can obtain these documents free of charge at the offices of the referring Sparkassen bank and the offices of Erste Bank der oesterreichischen Sparkassen AG. You can also access these documents electronically at www.erste-am.com.
Our analyses and conclusions are general in nature and do not take into account the individual characteristics of our investors in terms of earnings, taxation, experience and knowledge, investment objective, financial position, capacity for loss, and risk tolerance. Past performance is not a reliable indicator of the future performance of a fund.
Please note: Investments in securities entail risks in addition to the opportunities presented here. The value of units and their earnings can rise and fall. Changes in exchange rates can also have a positive or negative effect on the value of an investment. For this reason, you may receive less than your originally invested amount when you redeem your units. Persons who are interested in purchasing units in investment funds are advised to read the current fund prospectus(es) and the Information for Investors pursuant to § 21 AIFMG, especially the risk notices they contain, before making an investment decision. If the fund currency is different than the investor’s home currency, changes in the relevant exchange rate can positively or negatively influence the value of the investment and the amount of the costs associated with the fund in the home currency.
We are not permitted to directly or indirectly offer, sell, transfer, or deliver this financial product to natural or legal persons whose place of residence or domicile is located in a country where this is legally prohibited. In this case, we may not provide any product information, either.
Please consult the corresponding information in the fund prospectus and the Information for Investors pursuant to § 21 AIFMG for restrictions on the sale of the fund to American or Russian citizens.
It is expressly noted that this communication does not provide any investment recommendations, but only expresses our current market assessment. Thus, this communication is not a substitute for investment advice.
This document does not represent a sales activity of the Management Company and therefore may not be construed as an offer for the purchase or sale of financial or investment instruments.
Erste Asset Management GmbH is affiliated with the Erste Bank and austrian Sparkassen banks.
Please also read the “Information about us and our securities services” published by your bank.