
Who doesn’t know the saying “I can’t afford to buy cheap” in the context of consumer goods? It means that cheap (consumer) goods often don’t keep their promises, mostly in terms of durability, i.e. quality. Repeated replacement purchases and the quality product that one tends to ultimately buy after all add up to a price way beyond what one would have spent had one bought the quality product right from the start.
How does this relate to shares? Do quality shares beat out the rest in the long run as well? This is what we are going to discuss here.
The initial question comes with a number of follow-up ones: what are the marks of quality shares? Is it lower risk, higher return, or both? And, last but not least: how do we define the term quality for shares in the first place? We will also be looking at these issues in the following.
Company quality
The initial parameters defining the quality of a company are key financial ratios from the annual and quarterly reports. We analyse balance sheet, profit & loss, and cash flow statements, derive ratios, and compare them with those of other companies or the market average. This is called fundamental analysis.
In addition, we can also assess the quality of a company on the basis of so-called soft factors. Examples here are the ability of management to implement its strategy, or indeed management credibility. In this essay, we will be focusing on fundamental key ratios that permit investors to efficiently assess company quality and to separate the wheat from the chaff, if necessary.
There is a long tradition of quality assessment for bonds or real estate in the form of ratings or expert opinions. Quality in connection with shares emerged for the first time in the early 1930s, when Benjamin Graham used the concept. After the stock exchange crash of 1929, he was keen to systematically distinguish between good- and bad-quality shares on the basis of key ratios. Graham is therefore often considered the founder of fundamental analysis and value investing – the latter, because his focus was on the pric(ing) of a share in relation to its worth. Not for nothing do we still often use the term quality in connection with value today.
This is not correct, because growth shares in particular are often of high quality. This is also why in recent years, investment approaches such as quality-growth have come up, i.e. investing in companies that show both high growth and quality. According to today’s prevalent definition, quality shares are the shares of companies that are highly profitable, generate sustainable growth, and have low levels of business risk. Another frequent pillar of the definition is an attractive valuation, which, however, may differ between investment approaches.
Key ratios to determine quality
At this point in the text, we have already seen some terms that suggest how to define the quality of a share.
Let us start with profitability. Investors expect a high rate of return on their invested capital from a high-quality company. This is usually measured by various profitability ratios such as return on equity (ROE) or return on assets (ROA). Companies that can derive strong earnings from their sales are said to be highly profitable. This is why it makes sense to look at the profit margins of the company, e.g. net income margin or operating margin.
Another factor is the aforementioned risk of a company. The lower the financial debt, the lower the risk. The higher the debt, the higher the chance a company will be running into default, cannot service its debt anymore, and becomes bankruptThe debt to equity ratio of a company is suitable for a quick assessment of the debt situation of a company. Of course, we could go into more detail here (long-term vs. short-term debt ratios, profits or cash flows in relation to interest expenses), but this would go beyond the remit of this text.
It is also important to note that a high ROE and low debt are conflicting goals. A high ROE is often achieved by way of high financial leverage, i.e. levels of credit. Quality companies can ensure both, i.e. a high ROE and low debt. The ROA reveals whether a high ROE is due to high levels of debt.
The third typical mark of quality companies is growth. Growth means rising sales, which constitute the most important source of profit growth. Growing profits, in turn, lead to rising profitability and put the company in a position to service its debt. Quality companies therefore show a relatively constant rate of growth that has largely de-coupled from economic cycles. This constant rate of growth relates both to past sales and profits and to future forecasts.
The last aspect is the valuation of the company. It does not make any claims per se about the quality of a company and is therefore not directly regarded as one of the criteria of a quality company. However, the valuation becomes crucial when an investor is thinking about buying shares in the company. If the valuation is too high, even a high-quality company can turn into an unattractive investment. However, from my perspective this affects the question of value more than anything else, while this blog entry focuses on pure quality.
In conclusion of the theoretical part and as bridge to the practical, i.e. empirical part, let us have a look at key ratios that are the currently most widely used ones in the assessment of the quality of a company.
Much like for other market segments, there are numerous indices that reflect the segment of quality shares. The best-known index providers in this context are MSCI and Standard & Poor’s. Both firms use three key ratios to assess quality shares that differ slightly from each other. Both MSCI and S&P consider the ROE the most important parameter. Debt-to-equity is the second-most important ratio. The third ratio is where the two firms differ. Here, S&P refers to the balance sheet again, calculating the change in net assets (accruals ratio) of the company over the past two years. MSCI, on the other hand, bases its third ratio on the earnings situation of the company: it uses the earnings variability ratio, which shows how strongly earnings have fluctuated over the past five years. The more constant the earnings growth, the better the quality of the company.
Return of quality investing
From the perspective of an investor, the definition of quality in terms of companies is not the only important issue. It is also worth asking whether it makes sense to invest in high-quality companies in the long run. In theory one would expect that high quality – which is based on above-average profitability, lower business risk and stable growth – would be reflected in positive returns.
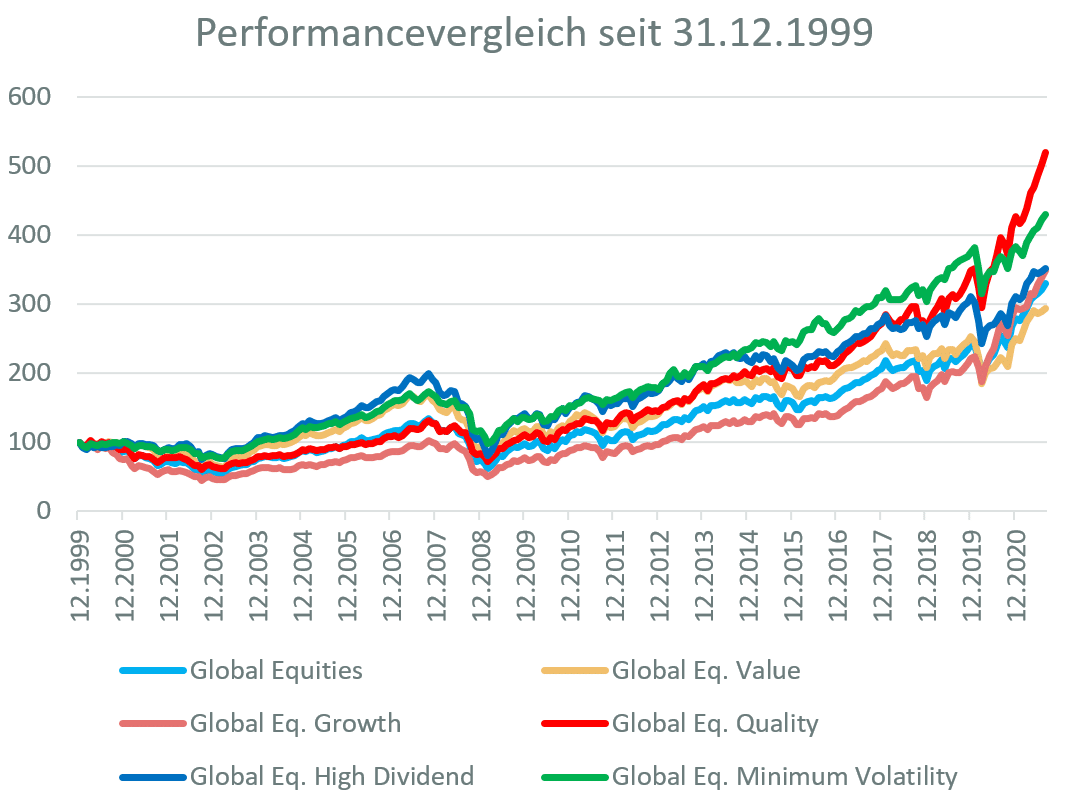
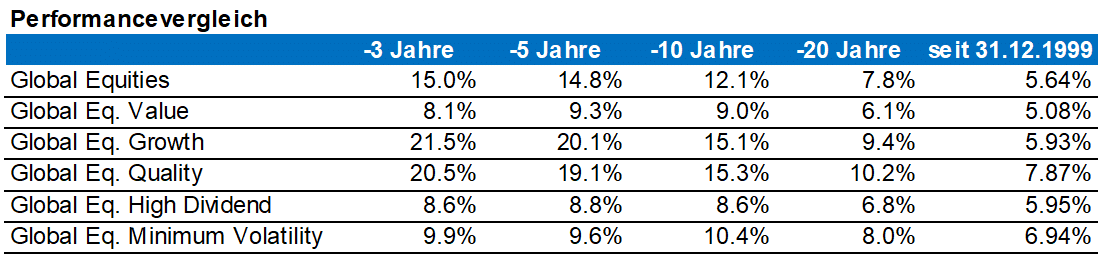
Comparing performances from the turn of the millennium onwards, we find that it would have definitely paid off to select shares on the basis of their quality, as the following chart illustrates. USD 100, invested in global shares at the end of 1999, turned into USD 329 by August 2021. This is tantamount to an annual return of +5.64%. Value investing is a very popular investment approach. In the aforementioned period, it would have turned USD 100 into USD 293 (+5.1% p.a.). In recent years, investor interest has homed in on technology companies with strong growth rates. The numbers show that a growth strategy would have paid off in the long(er) run as well and would have outperformed the broad market. More specifically, USD 100 in growth shares would have increased to USD 349 (+5.9% p.a.). But the biggest winners were quality shares: USD 100 would have turned into USD 519 (+7.87% p.a.). Thus, quality shares top the list of popular investment styles, followed by shares with low volatility (+6.94% p.a.; “minimum volatility” segment) and high dividend yield (+5.95%). This clearly answers the initial question about the point of selecting shares on the basis of quality criteria: the market segment of quality sustainably outperformed the broad market.
Performance since 31 December 1999
Sources: Bloomberg, own calculations
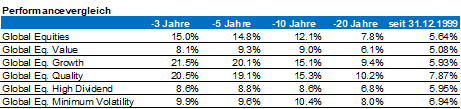
As the following table shows, quality shares have been neck-and-neck with growth shares in recent years. That being said, there have been significant overlaps. The heavyweights among the growth shares (Google, Apple, Amazon, Microsoft) tend to also qualify as quality shares.
Performances
Sources: Bloomberg, own calculations
The risk of quality investing
Having established that quality shares have achieved superior rates of return in the long run and have performed roughly in line with growth shares, we now have to take a closer look at the risk associated with investing in the quality segment.
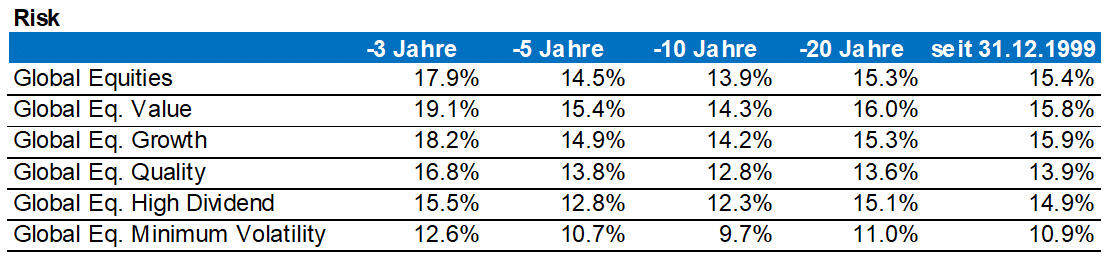
As pointed out initially, a low level of business risk is an important element of the definition of a quality company. Theoretically, one would expect this to translate into a lower price risk. A comparison of the investment styles since the end of 1999 confirms this expectation. With the exception of the minimum-volatility segment, quality shares experience the lowest level of volatility among all segments. The volatility of quality shares has been at 13.9% p.a. since the end of 1999, while the overall market has incurred 15.4%. During the same period, value and growth shares were at volatility levels of 15.8% and 15.9% p.a., respectively. Quality shares have also recorded the lowest level among all segments (ex minimum-volatility) in the most recent past, as the following table illustrates.
Risk
Sources: Bloomberg, own calculations
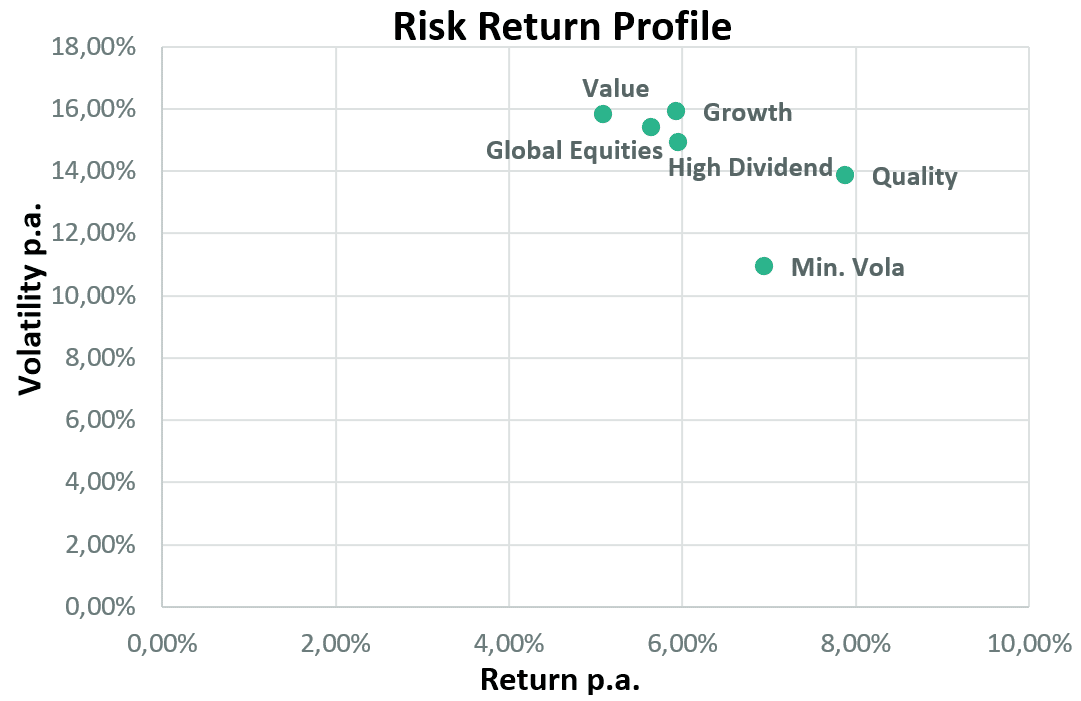
Finally, we want to take a look at the relationship of risk and return. As the following chart suggests, quality shares have by far the most attractive ratio of return and risk. On the basis of the previous tables, this also applies to the most recent past. While over some periods growth was gaining the upper hand, quality shares were always ahead in terms of risk.
Sources: Bloomberg, own calculations
Keep an eye on quality
In conclusion, we can state that the quality of a company affects the share price in the long run. In the short run, other segments may experience strong cycles. This was the case, for example, for high-dividend shares or shares with low volatility after the tech bubble had burst. In the long run, however, <Hinweis zu “a la Long” im Original: diese vor allem bei einer Austria-Fussballikone und jetzigem ORF-Fussballchefanalysten beliebte Phrase kommt aus dem Französichen und wird folgender Maßen geschrieben: à la longue> quality has come out on top, and it did so at relatively low levels of cyclicality. This means that the lower business risk and the sustainable growth have translated into lower volatility at superior risks in recent decades. Overall, quality shares developed according to what the theory would have suggested.
For the investor this means that following a strategy based on fundamental quality criteria definitely makes sense. Empirical evidence supports the fact that strong growth is good, but strong growth in tandem with quality is even better. In addition, as pointed out earlier: it is relatively easy to exclude shares of low quality and to identify high-quality shares by relying on a few important fundamental data.
Quality share funds
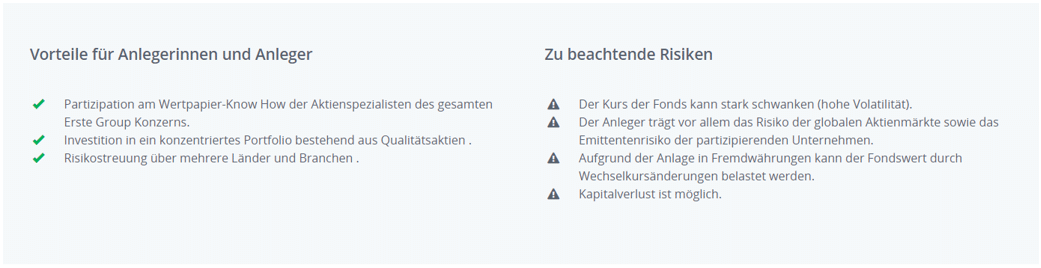
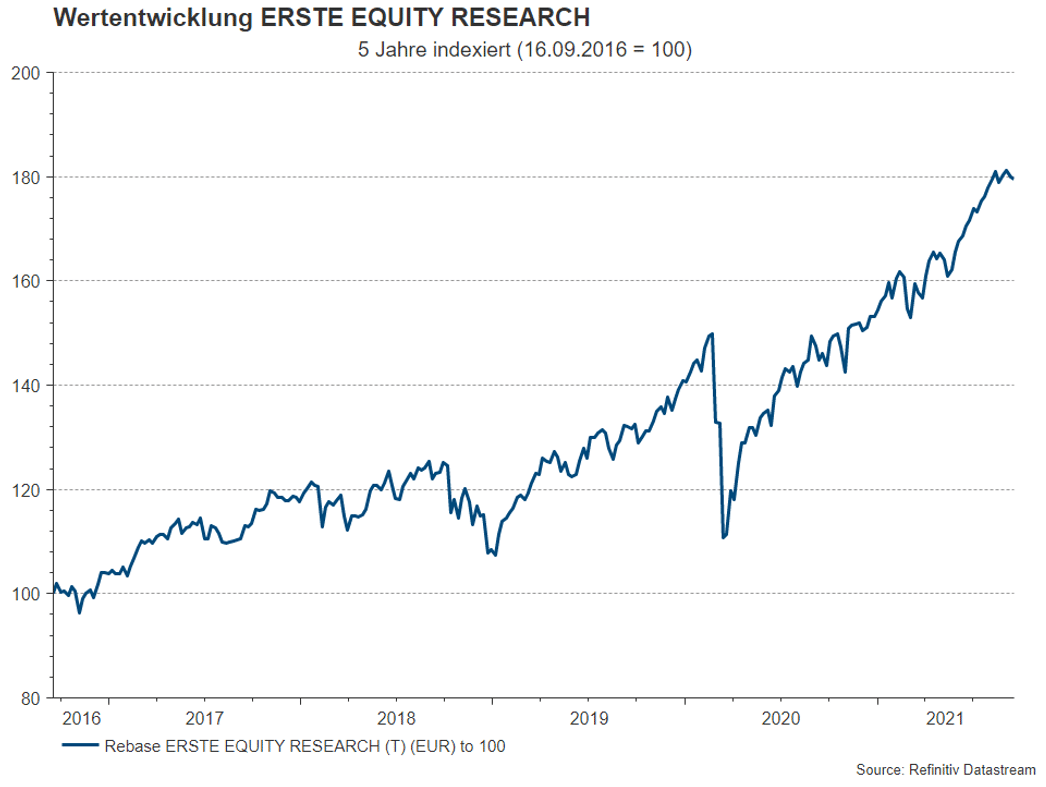
In the stock picking process, company quality is an important aspect that permeates the product range of Erste Asset Management. The ERSTE EQUITY RESEARCH is a case in point. This is a global equity fund that, in following an active investment approach, combines quality and growth, i.e. it pursues an explicit quality growth approach. The selection of companies of the funds is based on the publicly accessible list of recommendations by Erste Group Research.
Global players, i.e. the most important and biggest companies in their sectors, account for about 80% of this list, while so-called rising stars (i.e. companies that could become global players in the coming years) make up 20%. In the selection process, we focus on companies with a relatively stable earnings development and above-average profitability.
Source: Refinitiv Datastream
Legal note:
Prognoses are no reliable indicator for future performance.
Legal disclaimer
This document is an advertisement. Unless indicated otherwise, source: Erste Asset Management GmbH. The language of communication of the sales offices is German and the languages of communication of the Management Company also include English.
The prospectus for UCITS funds (including any amendments) is prepared and published in accordance with the provisions of the InvFG 2011 as amended. Information for Investors pursuant to § 21 AIFMG is prepared for the alternative investment funds (AIF) administered by Erste Asset Management GmbH pursuant to the provisions of the AIFMG in conjunction with the InvFG 2011.
The currently valid versions of the prospectus, the Information for Investors pursuant to § 21 AIFMG, and the key information document can be found on the website www.erste-am.com under “Mandatory publications” and can be obtained free of charge by interested investors at the offices of the Management Company and at the offices of the depositary bank. The exact date of the most recent publication of the prospectus, the languages in which the fund prospectus or the Information for Investors pursuant to Art 21 AIFMG and the key information document are available, and any other locations where the documents can be obtained are indicated on the website www.erste-am.com. A summary of the investor rights is available in German and English on the website www.erste-am.com/investor-rights and can also be obtained from the Management Company.
The Management Company can decide to suspend the provisions it has taken for the sale of unit certificates in other countries in accordance with the regulatory requirements.
Note: You are about to purchase a product that may be difficult to understand. We recommend that you read the indicated fund documents before making an investment decision. In addition to the locations listed above, you can obtain these documents free of charge at the offices of the referring Sparkassen bank and the offices of Erste Bank der oesterreichischen Sparkassen AG. You can also access these documents electronically at www.erste-am.com.
Our analyses and conclusions are general in nature and do not take into account the individual characteristics of our investors in terms of earnings, taxation, experience and knowledge, investment objective, financial position, capacity for loss, and risk tolerance. Past performance is not a reliable indicator of the future performance of a fund.
Please note: Investments in securities entail risks in addition to the opportunities presented here. The value of units and their earnings can rise and fall. Changes in exchange rates can also have a positive or negative effect on the value of an investment. For this reason, you may receive less than your originally invested amount when you redeem your units. Persons who are interested in purchasing units in investment funds are advised to read the current fund prospectus(es) and the Information for Investors pursuant to § 21 AIFMG, especially the risk notices they contain, before making an investment decision. If the fund currency is different than the investor’s home currency, changes in the relevant exchange rate can positively or negatively influence the value of the investment and the amount of the costs associated with the fund in the home currency.
We are not permitted to directly or indirectly offer, sell, transfer, or deliver this financial product to natural or legal persons whose place of residence or domicile is located in a country where this is legally prohibited. In this case, we may not provide any product information, either.
Please consult the corresponding information in the fund prospectus and the Information for Investors pursuant to § 21 AIFMG for restrictions on the sale of the fund to American or Russian citizens.
It is expressly noted that this communication does not provide any investment recommendations, but only expresses our current market assessment. Thus, this communication is not a substitute for investment advice.
This document does not represent a sales activity of the Management Company and therefore may not be construed as an offer for the purchase or sale of financial or investment instruments.
Erste Asset Management GmbH is affiliated with the Erste Bank and austrian Sparkassen banks.
Please also read the “Information about us and our securities services” published by your bank.