
Annualised real global GDP growth amounts to slightly above 3%. The composition of growth is not homogenuous. While the US economy grows strongly, the weakening loan growths puts weight on the economic activity in China. The intensified financial environment hurts emerging markets. The Eurozone and Japan show stabilizing trends. Overall one can observe a slight falling tendency of survey based indicators.
Inflation rates develop inhomogeneous as well. Overall there is a mild cyclical increase in inflation rates. Some emerging markets (Argentina, Turkey) are facing problems with inflation.
Political risk increased significantly („Brexit“, „Trade-War“). The US-Federal Reserve will increase the base rate by 25 basis points every quarter until year end and signals a rate of 3.1% until the end of 2019. From the ECB there is no news. The bond repurchasing program will expire at the end 2018. An interest rate hike within the Eurozone can be expected in the Summer of 2019, the earliest.
Source: ERSTE-SPARINVEST; www.erste-am.at; Data as of 31 August 2018;
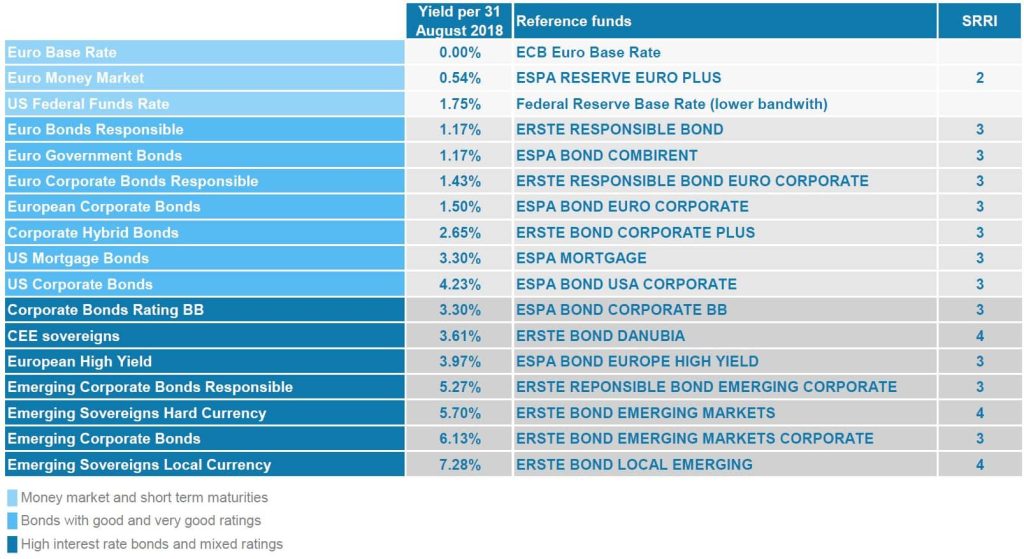
Fund-Ratio: Yield – see footnote 1)
1) NB: the fund ratio “yield” equals the average yield of the securities held by a fund prior to costs for forex hedging; please bear in mind that this ratio is not equivalent to the fund performance. For the fund performance (i.e. the development of the value) of the aforementioned funds, please refer to the overview table on page three. The above-cited table does also not account for any fees reducing return such as the management fee or individual account or depositary fees.
2) The risk classification of investment funds is based on the SRRI-indicator. The calculation is based on European regulatory requirements and forms an integral part of the Key Investor Document and gives the historical volatility of the fund unit price on a scale from 1 to 7, with 7 being the highest risk. More information about the calculation of the indicator: fundglossary.erste-am.com/srri/
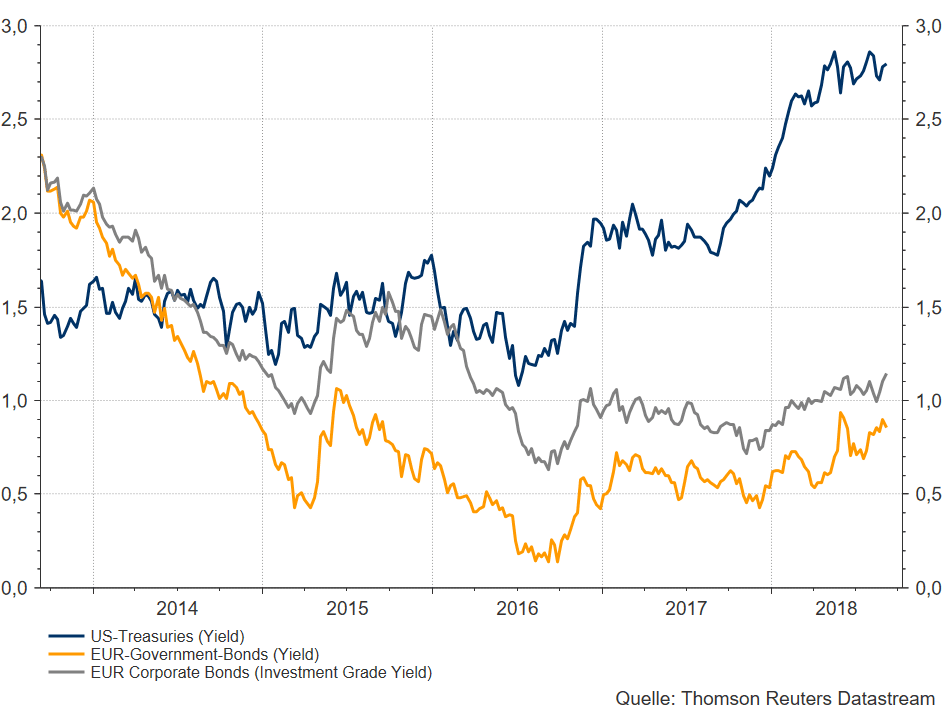
Development of bond yields of US- and EUR-Government-Bonds and EUR-Corporate-Bonds Investment-Grade (08/2013-08/2018)
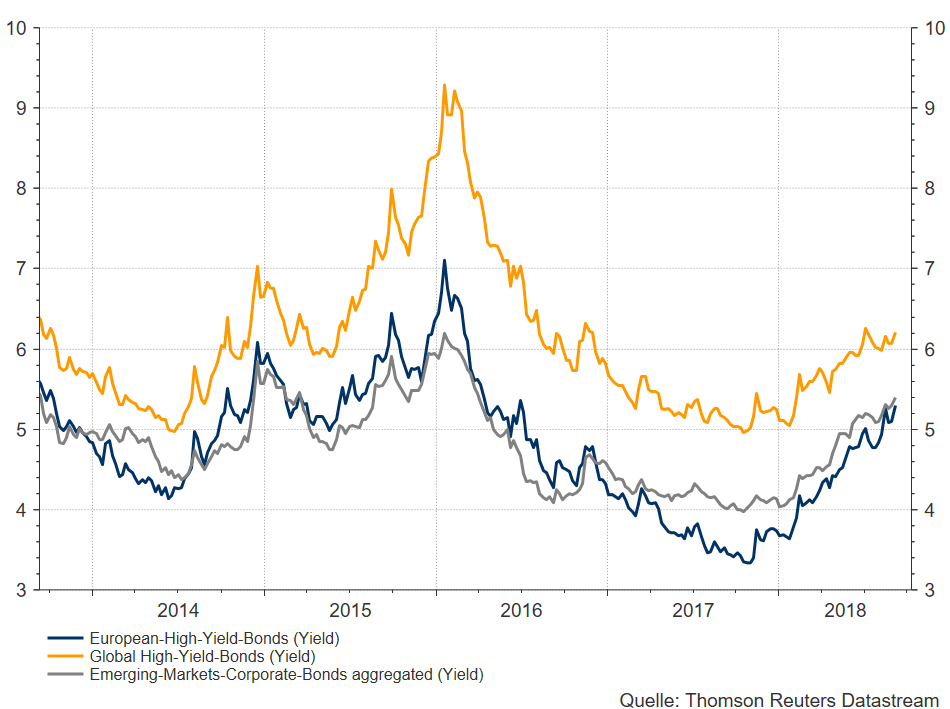
Development of bond yields of European High-Yield-Bonds compared with global High-Yield-Bonds and Emerging-Markets-Corporate-Bonds (08/2013-08/2018)
Please note:
The development of historic yields is not a reliable indicator for future developments of a specific asset category or asset class. The charts above do not include any fees or costs.
Ratio-Overview (more information can be found at www.erste-am.com)
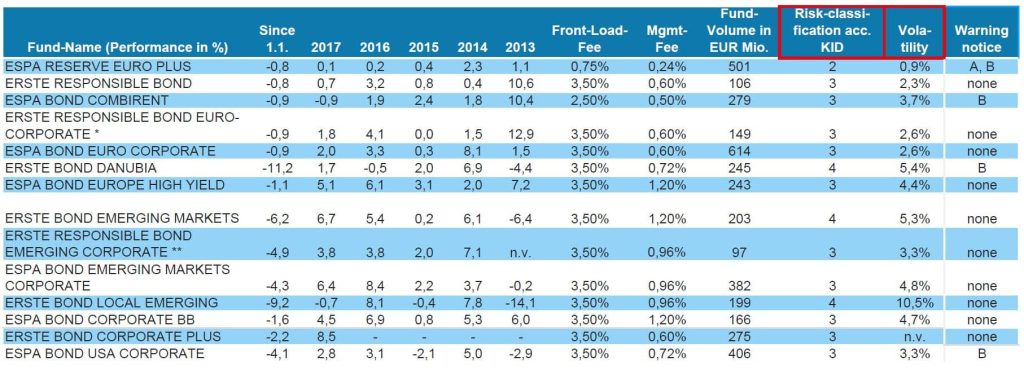
Data as of 31 August 2018.
The performance and volatility (3 years) is calculated in accordance with the OeKB method. It already includes the management fee. However, the illustration is net of the one-off load of up to 3.50%, which falls due at the time of purchase, and of other fees that reduce the return as well as of the individual account and deposit fees. Past performance is not a reliable indicator of the future performance of a fund.
Legal note:
Prognoses are no reliable indicator for future performance.
Legal disclaimer
This document is an advertisement. Unless indicated otherwise, source: Erste Asset Management GmbH. The language of communication of the sales offices is German and the languages of communication of the Management Company also include English.
The prospectus for UCITS funds (including any amendments) is prepared and published in accordance with the provisions of the InvFG 2011 as amended. Information for Investors pursuant to § 21 AIFMG is prepared for the alternative investment funds (AIF) administered by Erste Asset Management GmbH pursuant to the provisions of the AIFMG in conjunction with the InvFG 2011.
The currently valid versions of the prospectus, the Information for Investors pursuant to § 21 AIFMG, and the key information document can be found on the website www.erste-am.com under “Mandatory publications” and can be obtained free of charge by interested investors at the offices of the Management Company and at the offices of the depositary bank. The exact date of the most recent publication of the prospectus, the languages in which the fund prospectus or the Information for Investors pursuant to Art 21 AIFMG and the key information document are available, and any other locations where the documents can be obtained are indicated on the website www.erste-am.com. A summary of the investor rights is available in German and English on the website www.erste-am.com/investor-rights and can also be obtained from the Management Company.
The Management Company can decide to suspend the provisions it has taken for the sale of unit certificates in other countries in accordance with the regulatory requirements.
Note: You are about to purchase a product that may be difficult to understand. We recommend that you read the indicated fund documents before making an investment decision. In addition to the locations listed above, you can obtain these documents free of charge at the offices of the referring Sparkassen bank and the offices of Erste Bank der oesterreichischen Sparkassen AG. You can also access these documents electronically at www.erste-am.com.
Our analyses and conclusions are general in nature and do not take into account the individual characteristics of our investors in terms of earnings, taxation, experience and knowledge, investment objective, financial position, capacity for loss, and risk tolerance. Past performance is not a reliable indicator of the future performance of a fund.
Please note: Investments in securities entail risks in addition to the opportunities presented here. The value of units and their earnings can rise and fall. Changes in exchange rates can also have a positive or negative effect on the value of an investment. For this reason, you may receive less than your originally invested amount when you redeem your units. Persons who are interested in purchasing units in investment funds are advised to read the current fund prospectus(es) and the Information for Investors pursuant to § 21 AIFMG, especially the risk notices they contain, before making an investment decision. If the fund currency is different than the investor’s home currency, changes in the relevant exchange rate can positively or negatively influence the value of the investment and the amount of the costs associated with the fund in the home currency.
We are not permitted to directly or indirectly offer, sell, transfer, or deliver this financial product to natural or legal persons whose place of residence or domicile is located in a country where this is legally prohibited. In this case, we may not provide any product information, either.
Please consult the corresponding information in the fund prospectus and the Information for Investors pursuant to § 21 AIFMG for restrictions on the sale of the fund to American or Russian citizens.
It is expressly noted that this communication does not provide any investment recommendations, but only expresses our current market assessment. Thus, this communication is not a substitute for investment advice.
This document does not represent a sales activity of the Management Company and therefore may not be construed as an offer for the purchase or sale of financial or investment instruments.
Erste Asset Management GmbH is affiliated with the Erste Bank and austrian Sparkassen banks.
Please also read the “Information about us and our securities services” published by your bank.