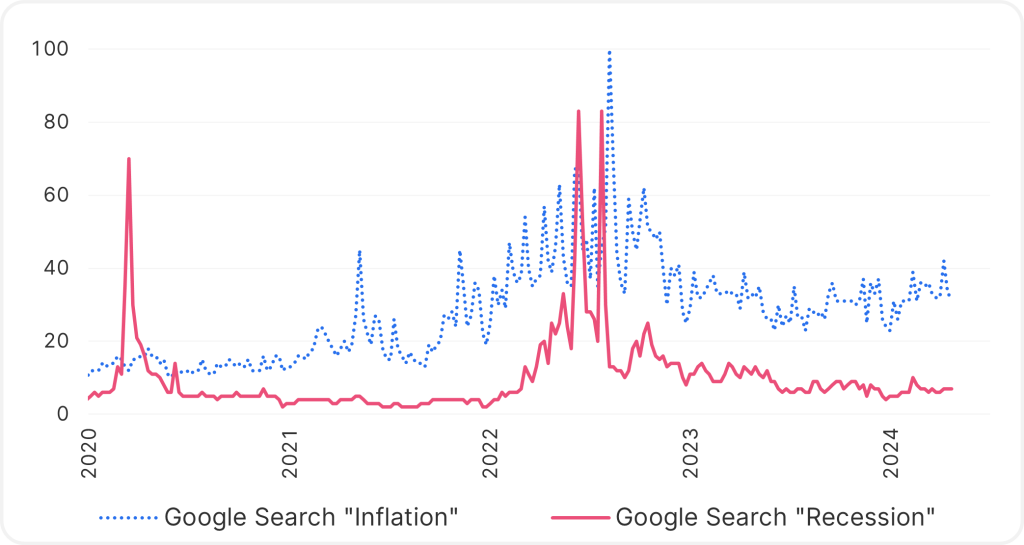
The topic of recession – primarily in the USA, as the most important economic region – is currently not overly prevalent in the media. The following chart shows Google searches for this term: public interest (red line) shows clear peaks in 2020 and 2022, after which it has remained subdued. By comparison, “inflation” is being searched for more frequently (blue line).
Google searches for “recession”
Sources: Bloomberg; Erste Asset Management Multi Asset Chartbook
The reason why a recession could still be imminent after all is the delayed effect of the massive global interest rate hikes since Q1 2022. These dampening measures have met with an unexpectedly resilient economy in the USA. However, whether this resilience lasts, remains to be seen. It has helped that companies and private individuals were able to lock in the zero interest rates to a certain extent until 2022.
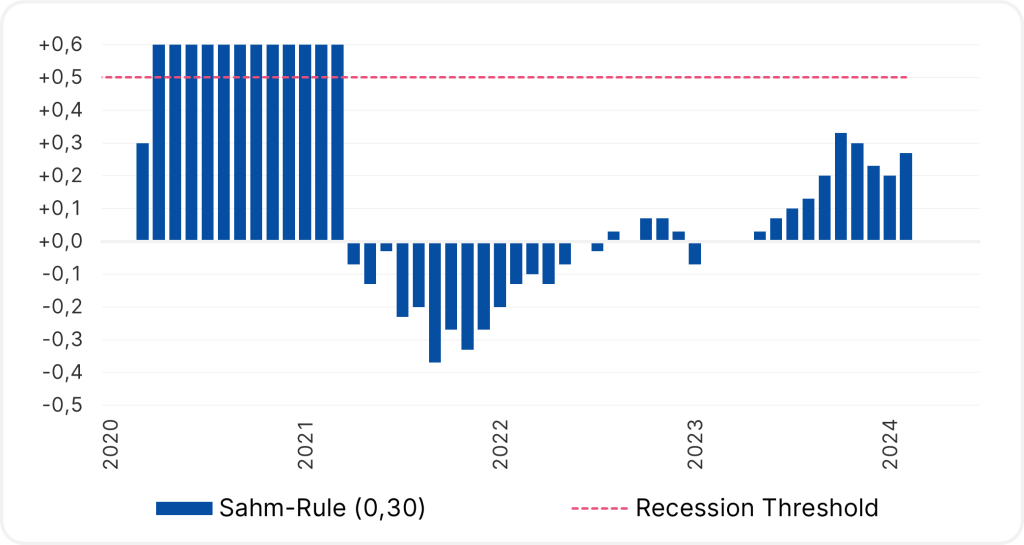
Sahm indicator
A key assumption is that a recession is accompanied by a sudden rise in unemployment, with all the associated negative consequences. The Sahm indicator measures this using a moving average of unemployment. The threshold value has not currently been reached, but the past three monthly values have shown an increase:
Sources: Bloomberg; Erste Asset Management Multi Asset Chartbook
However, only a decline in corporate profits would trigger widespread redundancies, and there are currently no signs of this happening.
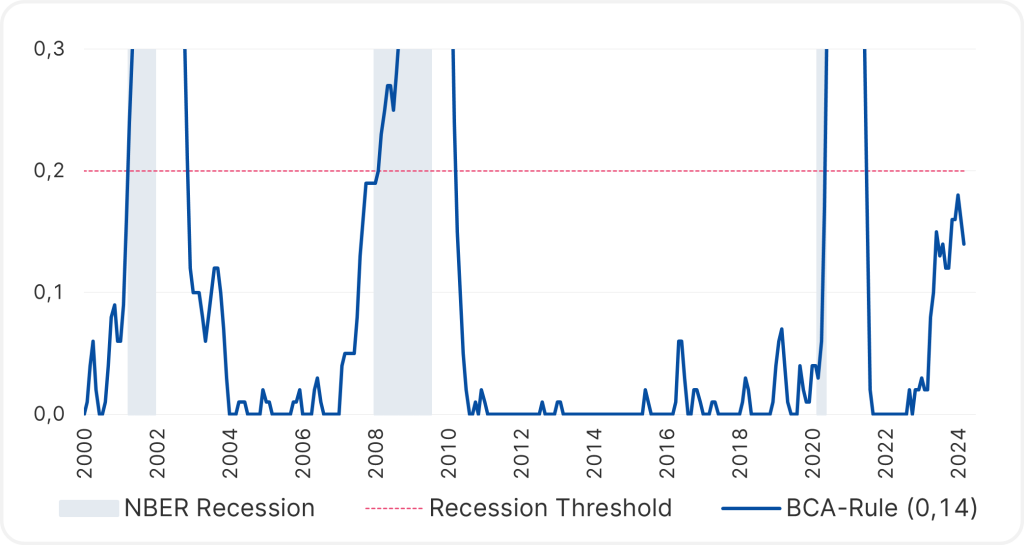
BCA indicator
The similar BCA indicator does not measure unemployment overall, but rather the number of people who could permanently leave the labour market due to no longer having sufficient skills. Here, too, the value is elevated:
Sources: Bloomberg; Erste Asset Management Multi Asset Chartbook
Historically, the US yield curve has been very informative, occasionally indicating via an inversion that the short-term interest rates are higher than interest rates in a long-term investment, which indicates economic uncertainty and a reluctance to make long-term plans.
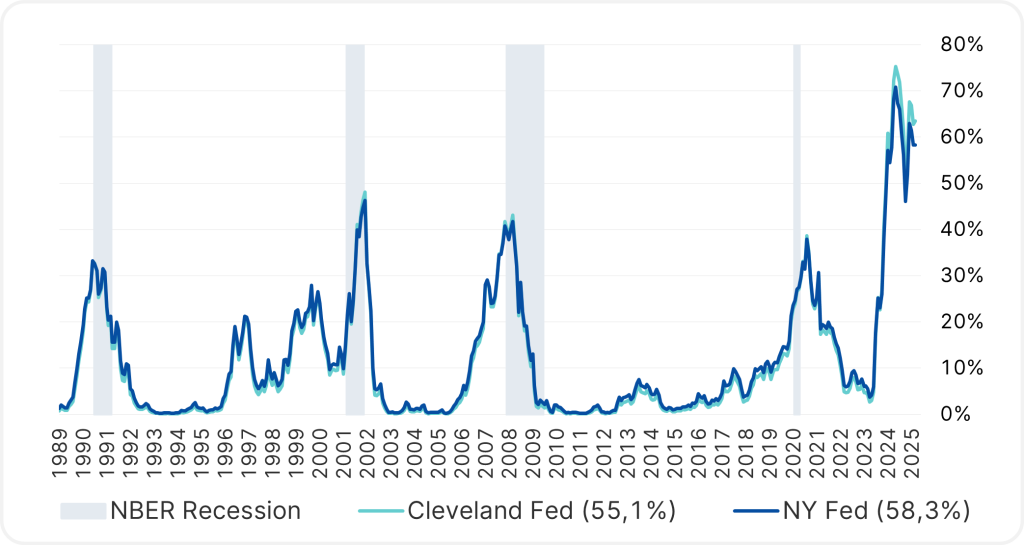
Recession forecast from the US yield curve
The US Federal Reserve uses the interest rate structure as an input factor for the probability of a recession – the model is therefore purely mechanistic and not qualitative, but in the past it has certainly been meaningful. However, it should always be borne in mind that, thankfully, recessions have not happened very often and therefore elude statistical analysis to a certain degree. The chart shows the result, which reflects the inversion that has been in place since 2022:
Sources: Bloomberg; Erste Asset Management Multi Asset Chartbook; Please note: Forecasts are no reliable indicator of future performance.
Immigration as protection against recession
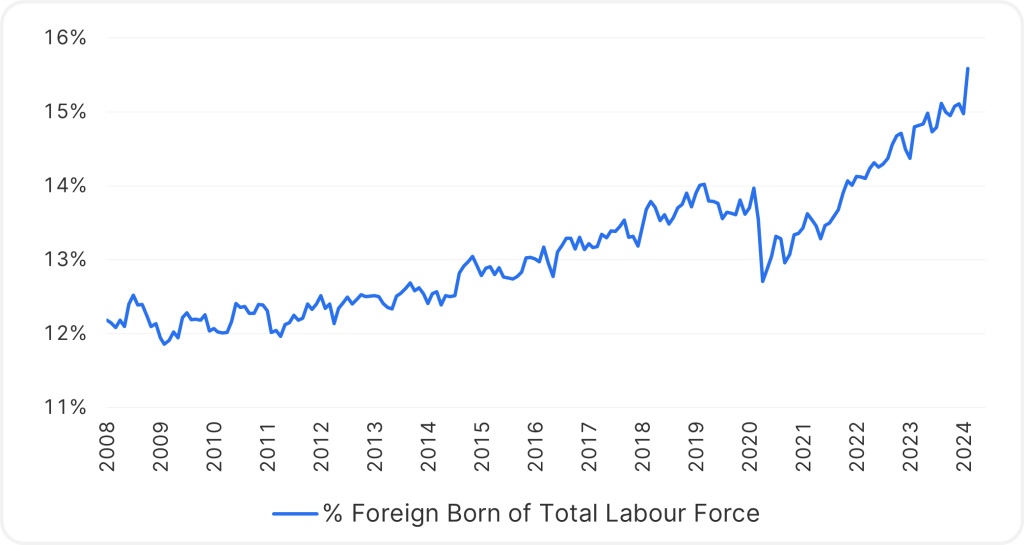
Interestingly, unemployment plays a dual role here: as an indicator in the event of a sudden increase, but also as an economy’s protective mechanism against distortions. The labour market in the USA has been exceptionally tight since the pandemic. Older workers in particular have left it, leading to a labour shortage. This has been offset by immigration, i.e. an influx of workers. The chart shows the rising proportion of workers who were not born in the USA:
Sources: Bloomberg; Erste Asset Management Multi Asset Chartbook
The influx of workers, for example from Mexico, has enabled the US economy since the pandemic to avoid an imbalance that would otherwise have occurred due to labour shortages.
“Don’t fight the US Consumer” as protection against recession
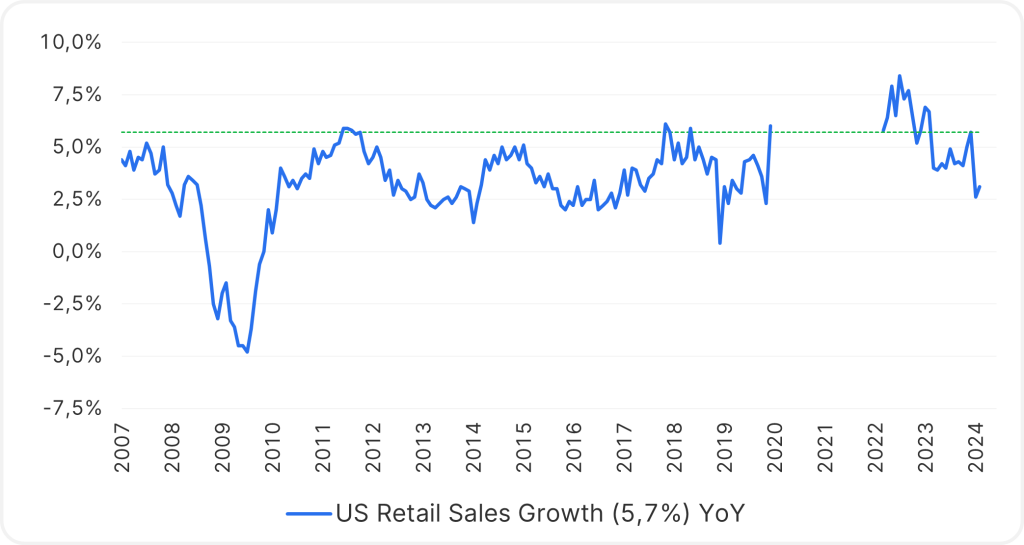
Finally, consumers in the USA are notoriously keen on spending, but are no longer as highly leveraged as they were before the 2008 financial crisis. Consumer spending flows directly into GDP and thus offers protection against its reduction or recession. The chart shows that spending is ambitious by historical standards:
Sources: Bloomberg; Erste Asset Management Multi Asset Chartbook
Conclusion
Although a US recession has receded from view, it is worth monitoring indicators to ensure that investment managers can react quickly and tactically should it materialise.
Legal disclaimer
This document is an advertisement. Unless indicated otherwise, source: Erste Asset Management GmbH. The language of communication of the sales offices is German and the languages of communication of the Management Company also include English.
The prospectus for UCITS funds (including any amendments) is prepared and published in accordance with the provisions of the InvFG 2011 as amended. Information for Investors pursuant to § 21 AIFMG is prepared for the alternative investment funds (AIF) administered by Erste Asset Management GmbH pursuant to the provisions of the AIFMG in conjunction with the InvFG 2011.
The currently valid versions of the prospectus, the Information for Investors pursuant to § 21 AIFMG, and the key information document can be found on the website www.erste-am.com under “Mandatory publications” and can be obtained free of charge by interested investors at the offices of the Management Company and at the offices of the depositary bank. The exact date of the most recent publication of the prospectus, the languages in which the fund prospectus or the Information for Investors pursuant to Art 21 AIFMG and the key information document are available, and any other locations where the documents can be obtained are indicated on the website www.erste-am.com. A summary of the investor rights is available in German and English on the website www.erste-am.com/investor-rights and can also be obtained from the Management Company.
The Management Company can decide to suspend the provisions it has taken for the sale of unit certificates in other countries in accordance with the regulatory requirements.
Note: You are about to purchase a product that may be difficult to understand. We recommend that you read the indicated fund documents before making an investment decision. In addition to the locations listed above, you can obtain these documents free of charge at the offices of the referring Sparkassen bank and the offices of Erste Bank der oesterreichischen Sparkassen AG. You can also access these documents electronically at www.erste-am.com.
Our analyses and conclusions are general in nature and do not take into account the individual characteristics of our investors in terms of earnings, taxation, experience and knowledge, investment objective, financial position, capacity for loss, and risk tolerance. Past performance is not a reliable indicator of the future performance of a fund.
Please note: Investments in securities entail risks in addition to the opportunities presented here. The value of units and their earnings can rise and fall. Changes in exchange rates can also have a positive or negative effect on the value of an investment. For this reason, you may receive less than your originally invested amount when you redeem your units. Persons who are interested in purchasing units in investment funds are advised to read the current fund prospectus(es) and the Information for Investors pursuant to § 21 AIFMG, especially the risk notices they contain, before making an investment decision. If the fund currency is different than the investor’s home currency, changes in the relevant exchange rate can positively or negatively influence the value of the investment and the amount of the costs associated with the fund in the home currency.
We are not permitted to directly or indirectly offer, sell, transfer, or deliver this financial product to natural or legal persons whose place of residence or domicile is located in a country where this is legally prohibited. In this case, we may not provide any product information, either.
Please consult the corresponding information in the fund prospectus and the Information for Investors pursuant to § 21 AIFMG for restrictions on the sale of the fund to American or Russian citizens.
It is expressly noted that this communication does not provide any investment recommendations, but only expresses our current market assessment. Thus, this communication is not a substitute for investment advice.
This document does not represent a sales activity of the Management Company and therefore may not be construed as an offer for the purchase or sale of financial or investment instruments.
Erste Asset Management GmbH is affiliated with the Erste Bank and austrian Sparkassen banks.
Please also read the “Information about us and our securities services” published by your bank.


