It is almost impossible to speak with fund managers and not address the economy or monetary policy. Why is that so? This blog entry will try to answer the question on the basis of data from the US equity market from 1950 onwards.
Prior to the analysis itself, we would like to outline a few terms and concepts.
- US equities (or shares) and their return in this context refer to the total return of the S&P 500 index. The total return is made up of two components: price increase and dividends, where we assume reinvestment.
- We have used monthly data from January 1950 to June 2017, i.e. a total of 809 months.
- We define a phase of interest rate cuts as period from the initial rate cut to the first rate hike by the Federal Reserve. The interest rate increase heralds a phase of interest rate increases, which, accordingly, ends on the first rate cut.
- The key-lending rate that we have used were, in accordance with their importance as monetary instrument of the US Fed, at first the discount rate and then the Fed funds target rate.
- Recession phases are defined in accordance with the official assessment by the National Bureau of Economic Research (NBER). The USA has an own, dedicated agency that officially declares when the US economy is in recession (http://www.nber.org/cycles.html). We are following this definition.
- Given that the NBER declares recessions only with a time lag, the information is not useful as indicator for the timing of the equity market. This also explains why fund managers and analysts use different methods to ascertain whether the economy is in recession or expanding. This is also an interesting topic for a future blog entry.
A picture is worth 1000 words
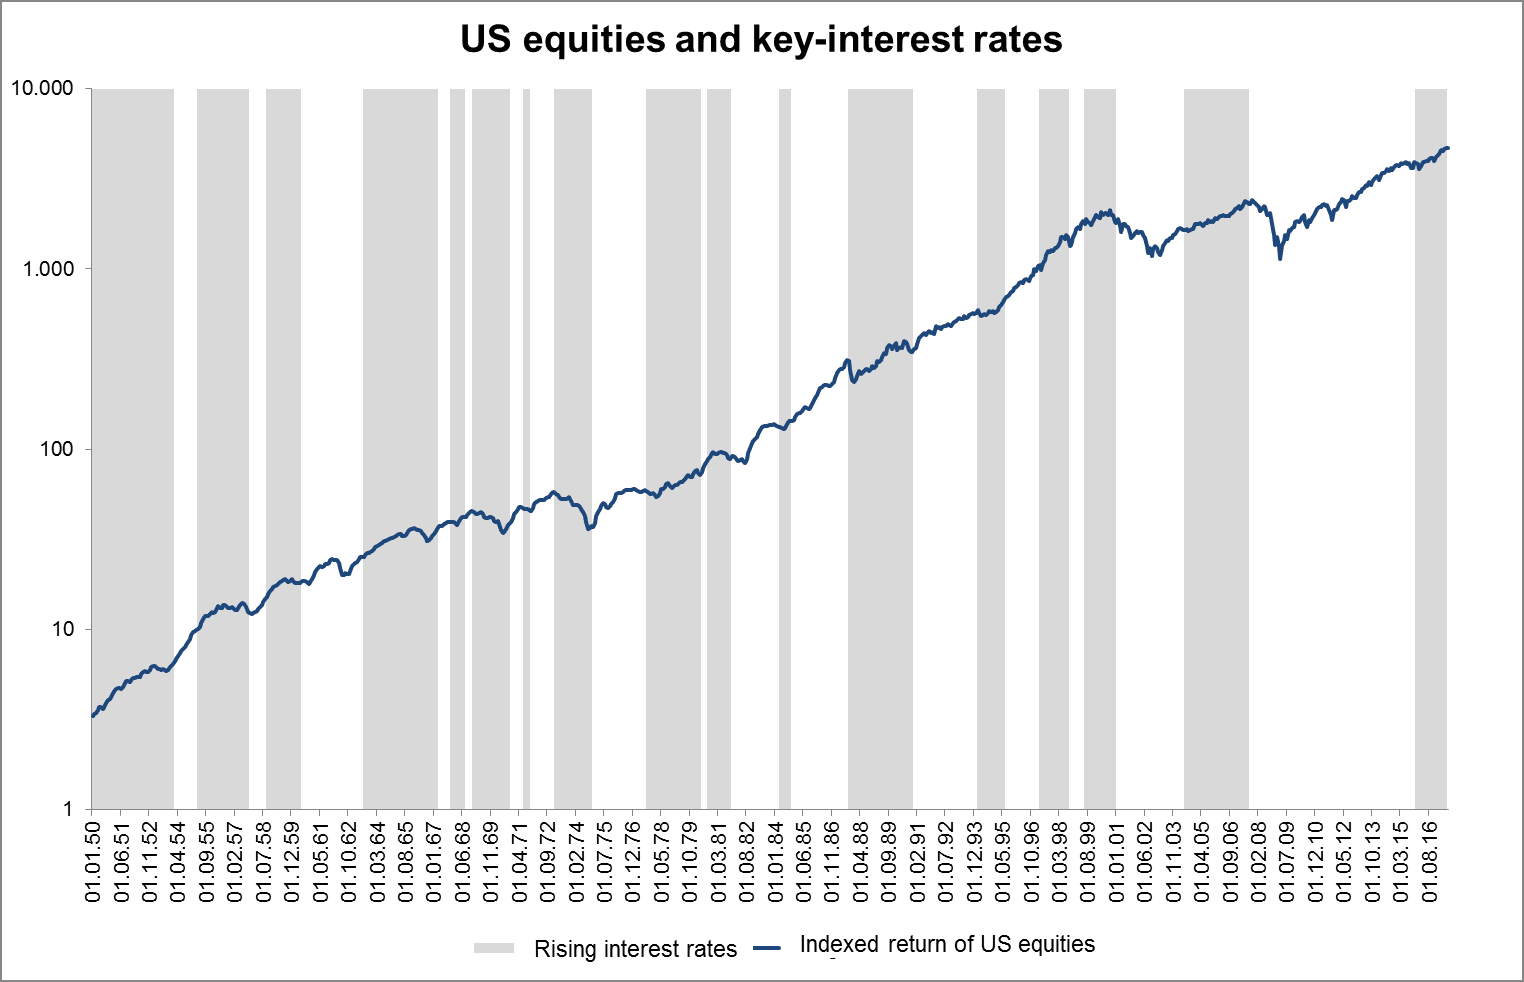
Every analyst knows that a report hinges on the visualisation of data, i.e. the eyeballing. Let’s eyeball. The following chart shows the S&P 500 index since 1950. The phases of interest rate increases are shaded grey. It seems to us that equities typically slump at the end of an interest rate increase cycle. This pattern is particularly clear during the phases of interest rate increases at the beginning of the data set. This is in line with theory: central banks step up rates as soon as the economy is picking up momentum. Or, like the former chairman of the Fed, William McChesney Martin, phrased it so poignantly: “The Fed’s job is to take away the punch bowl just as the party gets going.”

Source: Thomson Financial; Erste AM; own calculations;
Please note: Past performance is not a reliable indicator for future developments.
Higher interest rates burden companies which then incur higher interest expense while providing investors on the money and bond market with attractive investment opportunities. Both aspects are burdensome to the equity market. At some point, the burden becomes excessive, and as a result the equity market drops.
Interestingly, with regard to the phases of interest rate hikes prior to the recessions of 2011 and 2008, the equities only reacted after the periods of rate hikes were over. In both cases, the US central bank reacted to “crises on the financial market” in its interest rate policy. In 2001, to the bursting of the dotcom bubble and 9/11, in 2008 to the Great Financial Crisis that forced the central banks to react by cutting interest rates massively so as to prevent the equity markets from crashing and thus by stabilising them.
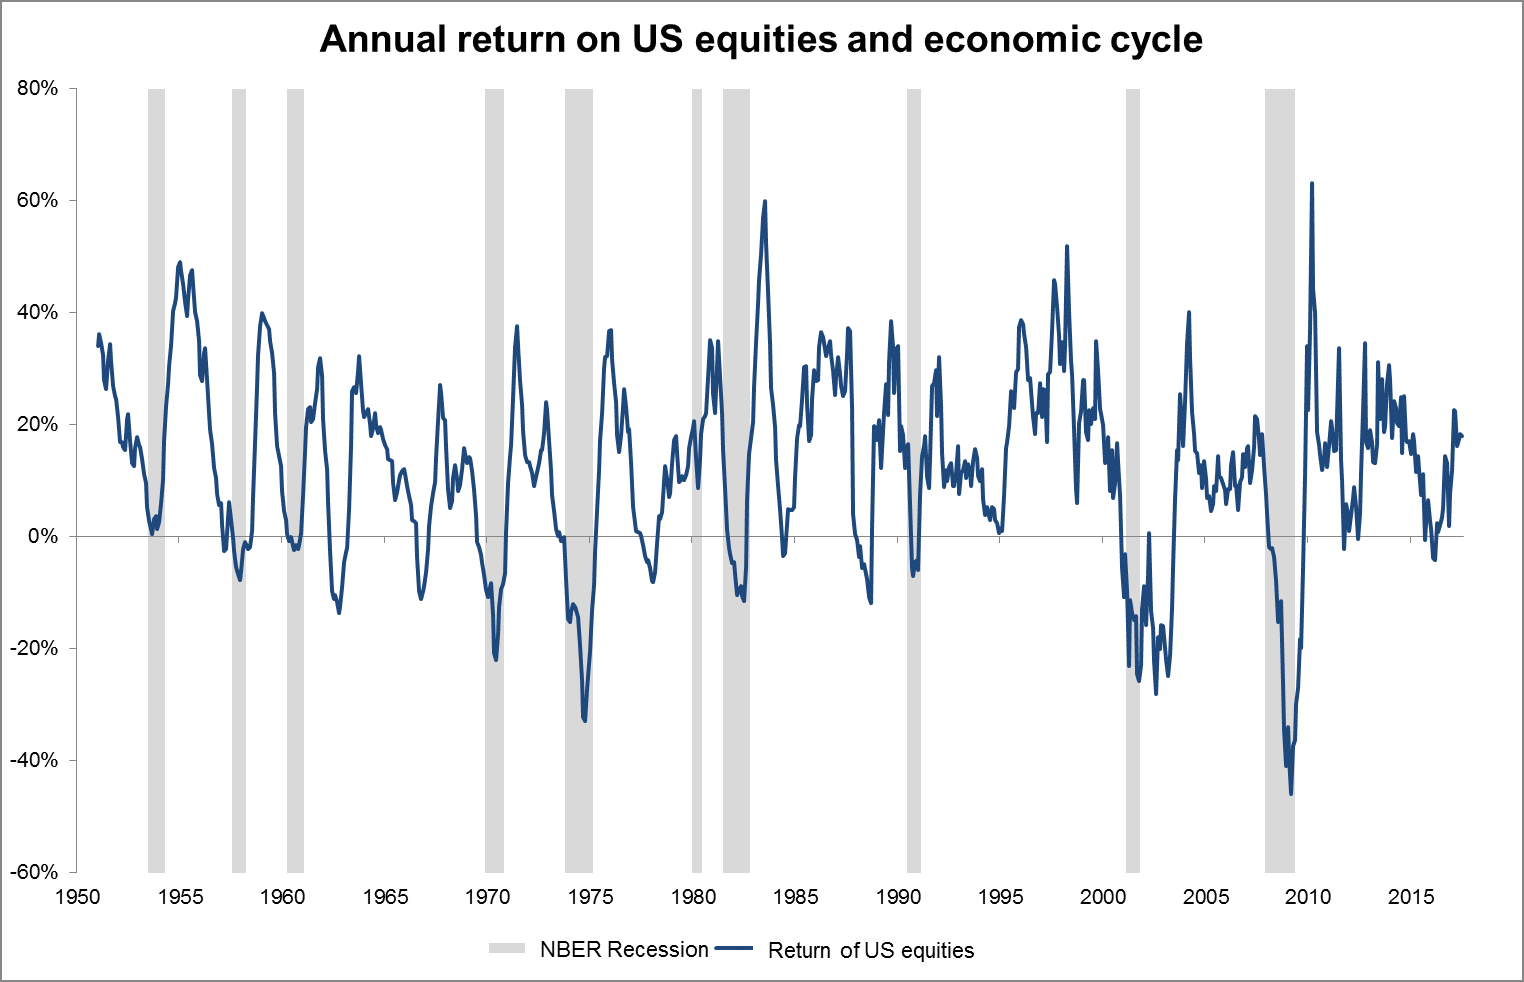
As far as the economic cycle is concerned, the following chart shows the phases of recession (grey shading) and the return on shares on a year-on-year basis. We believe there is a learning point in here as well. While not all phases of low equity return go hand in hand with a recession, all recessions are accompanied by a phase of weakness on the equity markets. Clearly, recessions are poison to the equity market.

Source: Thomson Financial; Erste AM; own calculations;
Please note: Past performance is not a reliable indicator for future developments.
The data support the notion that the economic and interest cycle drive return and risk
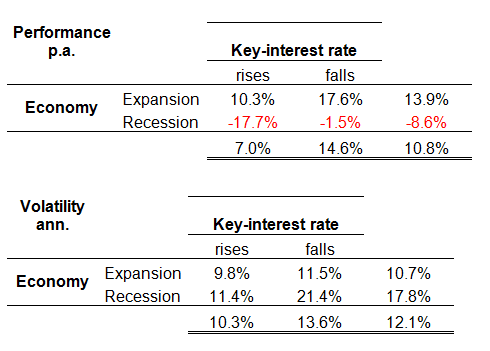
The first chart is also reflected in the concrete numbers: in phases where the US economy was locked into a recession, shares would produce an annualised loss of 8.6% p.a. “It’s the economy, stupid!”, as the slogan from Bill Clinton’s first campaign put it rather succinctly. But the interest rates also have an effect on equities that can be supported by data. During phases of falling key-lending rates, the return of equities was about twice as high as during phases of interest rate hikes at 14.6%.

Source: Thomson Financial; Erste AM; own calculations; Please note: Past performance is not a reliable indicator for future developments. The return- and volatility numbers there are net of fees or taxes.
The picture becomes clearer still when we look at the effect of both criteria. A phase of economic expansion and falling interest rates is by far the best environment for shares. Here, shares have recorded a rate of return of 17.6% in the past. In periods of recession with rising key-lending rates, i.e. at the start of a recession, shares would incur losses of 17.7% per year – i.e. a difference of more than 35 percentage points.
The picture is similar with respect to risk, albeit not as drastic. The outstanding period is the phase of recession combined with falling key-lending rates. This is the final phase of a recession, where the markets are bottoming out. As a result, the share returns turn from negative to positive, with occasional setbacks every time initial hopes are being disappointed. This is what leads to an extremely elevated level of volatility.
What is the status quo?
By raising interest rates on 16 December 2015, the US Fed launched a phase of rising interest rates. Although this phase has been going on for 18 months, it is still in its initial stages due to the particularly cautious modus operandi of the central bank. We believe that we are not yet at a level where we would have to worry about the economy. In terms of the aforementioned parameters, we are still in the second-best phase for equities (expansion amid rising key-lending rates). Good returns at low volatilities – exactly what we have seen in the past months. The optimist would say, the glass is half-full.
However, the analysis also shows that drifting off into recession would immediately take us to the worst phase for equities. To this extent, the glass is already half-empty. The crucial question is how the economy will be performing from here on in. At the moment, the majority of economic indicators are still suggesting an expansionary phase. We believe that will remain the case in the coming months. Therefore, investors should currently overweight equities but should be aware that the next regrouping will probably entail a reduction of risk.
Legal disclaimer
This document is an advertisement. Unless indicated otherwise, source: Erste Asset Management GmbH. The language of communication of the sales offices is German and the languages of communication of the Management Company also include English.
The prospectus for UCITS funds (including any amendments) is prepared and published in accordance with the provisions of the InvFG 2011 as amended. Information for Investors pursuant to § 21 AIFMG is prepared for the alternative investment funds (AIF) administered by Erste Asset Management GmbH pursuant to the provisions of the AIFMG in conjunction with the InvFG 2011.
The currently valid versions of the prospectus, the Information for Investors pursuant to § 21 AIFMG, and the key information document can be found on the website www.erste-am.com under “Mandatory publications” and can be obtained free of charge by interested investors at the offices of the Management Company and at the offices of the depositary bank. The exact date of the most recent publication of the prospectus, the languages in which the fund prospectus or the Information for Investors pursuant to Art 21 AIFMG and the key information document are available, and any other locations where the documents can be obtained are indicated on the website www.erste-am.com. A summary of the investor rights is available in German and English on the website www.erste-am.com/investor-rights and can also be obtained from the Management Company.
The Management Company can decide to suspend the provisions it has taken for the sale of unit certificates in other countries in accordance with the regulatory requirements.
Note: You are about to purchase a product that may be difficult to understand. We recommend that you read the indicated fund documents before making an investment decision. In addition to the locations listed above, you can obtain these documents free of charge at the offices of the referring Sparkassen bank and the offices of Erste Bank der oesterreichischen Sparkassen AG. You can also access these documents electronically at www.erste-am.com.
Our analyses and conclusions are general in nature and do not take into account the individual characteristics of our investors in terms of earnings, taxation, experience and knowledge, investment objective, financial position, capacity for loss, and risk tolerance. Past performance is not a reliable indicator of the future performance of a fund.
Please note: Investments in securities entail risks in addition to the opportunities presented here. The value of units and their earnings can rise and fall. Changes in exchange rates can also have a positive or negative effect on the value of an investment. For this reason, you may receive less than your originally invested amount when you redeem your units. Persons who are interested in purchasing units in investment funds are advised to read the current fund prospectus(es) and the Information for Investors pursuant to § 21 AIFMG, especially the risk notices they contain, before making an investment decision. If the fund currency is different than the investor’s home currency, changes in the relevant exchange rate can positively or negatively influence the value of the investment and the amount of the costs associated with the fund in the home currency.
We are not permitted to directly or indirectly offer, sell, transfer, or deliver this financial product to natural or legal persons whose place of residence or domicile is located in a country where this is legally prohibited. In this case, we may not provide any product information, either.
Please consult the corresponding information in the fund prospectus and the Information for Investors pursuant to § 21 AIFMG for restrictions on the sale of the fund to American or Russian citizens.
It is expressly noted that this communication does not provide any investment recommendations, but only expresses our current market assessment. Thus, this communication is not a substitute for investment advice.
This document does not represent a sales activity of the Management Company and therefore may not be construed as an offer for the purchase or sale of financial or investment instruments.
Erste Asset Management GmbH is affiliated with the Erste Bank and austrian Sparkassen banks.
Please also read the “Information about us and our securities services” published by your bank.

