 – peaks and troughs")
Investing for the long or the short term? This is the question bond investors ask. In this blog, we will have a look at German government bonds with a remaining time to maturity of two years (2Y; short) and ten years (10Y; long). More specifically, we are interested in the yield differential between the long- and the short-term interest rates. The technical term here is the “slope of the yield curve”.
German government bonds – slope of the yield curve, long-term assessment
The chart shows the yield for German government bonds with a remaining time to maturity of 10Y (dark blue) vs. those with 2Y (light blue). In addition to the absolute yield, the yield differential is particularly important. In the chart below, this manifests as “peaks and troughs”.
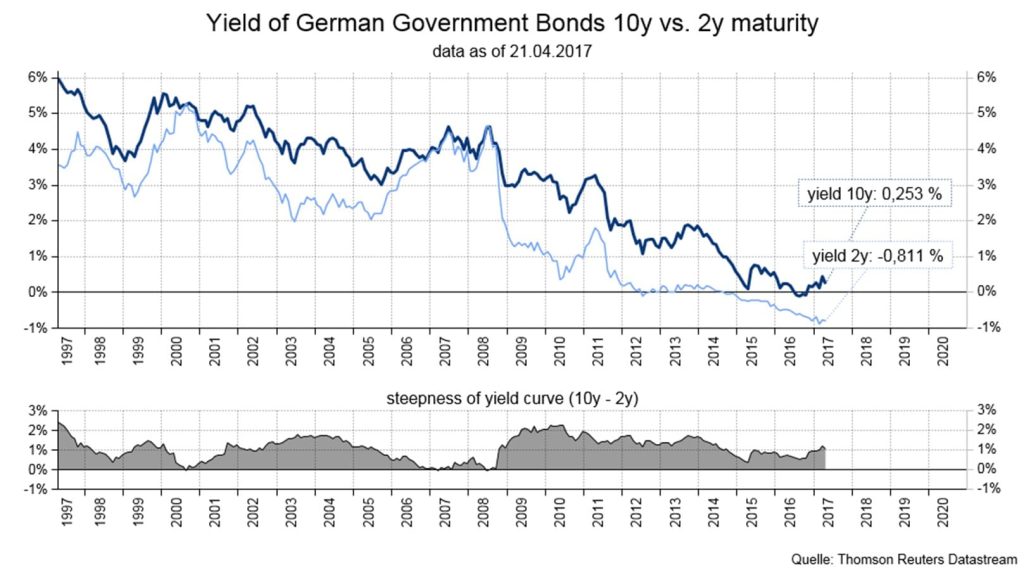
Chart: yield German government bonds 2Y vs 10Y (above); yield differential (below); observation period 20 years. deutsche
Source: Datastream, as of 17 April 2017
The chart clearly indicates that the yield differential (10 Y minus 2Y remaining time to maturity) is not constant over time.
- If the yield for 10Y is clearly above 2Y, the yield curve is referred to as steep – in the chart, this is illustrated by a peak.
- If the yield differential is very low, the yield curve is referred to as flat – in the chart, this is illustrated by a trough.
- If the yield of the short maturity is higher than that of the long maturity, experts call the scenario an inverse yield curve. However, this is a very rare phenomenon and actually never happened during the observation period.
The reason for the changes in the slope of the yield curve:
The slope of the curve is calculated as the difference of the yield for the respective remaining time to maturity of 2Y vs. 10Y. This means a change can come from either end – from the long and the short one.
Usually, different factors affect the two parts of the yield curve:
- The long end of the curve (10Y) is the classic segment of long-term investors such as for example (pension) funds. Fundamental concerns like inflation development and economic performance crucially affect the yield.
- The short end (2Y) is used to a large degree to “park” money. This segment tends to be affected much more strongly by the central bank policies.
Investors usually expect a higher interest rate for longer periods of investment. This is why the yield curve is largely steep (i.e. normal) throughout the observation period.
The lower part of the chart (“Peaks and troughs”) clearly illustrates at what point something extraordinary occurred on the financial markets, because at those times the slope of the yield curve would change drastically. The most recent events happened in 2000/01 (technology bubble, stock market crash) and in 2008 (Lehman bankruptcy, stock market crash). In both cases the short-term interest rates increased rapidly (triggered by the central banks), and indeed more so than the long-term interest rates (i.e. flattening of the yield curve).
As another example in this context, this chart illustrates the yield curve of June 2008:
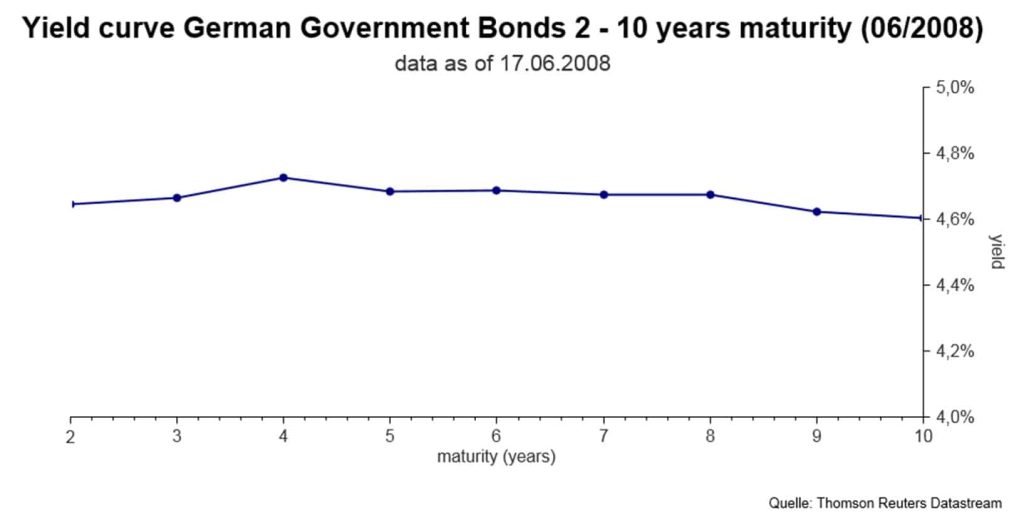
Chart: yield curve German government bonds, 2-10Y; as of 17 June 2008
Source: Datastream
The yield was almost the same across all maturities on 17 June 2008. So that yield curve really was flat.
Why do investors need this information?
The steeper the yield curve, the bigger the compensation for future risk (especially inflation). In other words, if the yield curve is steep (normal), there are no significant strains in the market, i.e. the asset markets are calm. If the curve flattens a lot, this may be so for several reasons. If the flattening happens quickly, it suggests stress in the financial markets. At these moments, investors prefer to “flee” into cash. (Although very often the best investment opportunities present themselves during stormy times.)
Conclusion:
Peaks and troughs are crucial concepts in the analysis of yield curves. The historical development should also always be taken into account. Interest markets are very efficient, because a large number of market participants with different goals meet in the market place. The slope of the yield curve can offer a very good insight into the status quo of the financial markets.
Yield curve management is part of the active management of the funds of Erste Asset Management.
Legal disclaimer
This document is an advertisement. Unless indicated otherwise, source: Erste Asset Management GmbH. The language of communication of the sales offices is German and the languages of communication of the Management Company also include English.
The prospectus for UCITS funds (including any amendments) is prepared and published in accordance with the provisions of the InvFG 2011 as amended. Information for Investors pursuant to § 21 AIFMG is prepared for the alternative investment funds (AIF) administered by Erste Asset Management GmbH pursuant to the provisions of the AIFMG in conjunction with the InvFG 2011.
The currently valid versions of the prospectus, the Information for Investors pursuant to § 21 AIFMG, and the key information document can be found on the website www.erste-am.com under “Mandatory publications” and can be obtained free of charge by interested investors at the offices of the Management Company and at the offices of the depositary bank. The exact date of the most recent publication of the prospectus, the languages in which the fund prospectus or the Information for Investors pursuant to Art 21 AIFMG and the key information document are available, and any other locations where the documents can be obtained are indicated on the website www.erste-am.com. A summary of the investor rights is available in German and English on the website www.erste-am.com/investor-rights and can also be obtained from the Management Company.
The Management Company can decide to suspend the provisions it has taken for the sale of unit certificates in other countries in accordance with the regulatory requirements.
Note: You are about to purchase a product that may be difficult to understand. We recommend that you read the indicated fund documents before making an investment decision. In addition to the locations listed above, you can obtain these documents free of charge at the offices of the referring Sparkassen bank and the offices of Erste Bank der oesterreichischen Sparkassen AG. You can also access these documents electronically at www.erste-am.com.
Our analyses and conclusions are general in nature and do not take into account the individual characteristics of our investors in terms of earnings, taxation, experience and knowledge, investment objective, financial position, capacity for loss, and risk tolerance. Past performance is not a reliable indicator of the future performance of a fund.
Please note: Investments in securities entail risks in addition to the opportunities presented here. The value of units and their earnings can rise and fall. Changes in exchange rates can also have a positive or negative effect on the value of an investment. For this reason, you may receive less than your originally invested amount when you redeem your units. Persons who are interested in purchasing units in investment funds are advised to read the current fund prospectus(es) and the Information for Investors pursuant to § 21 AIFMG, especially the risk notices they contain, before making an investment decision. If the fund currency is different than the investor’s home currency, changes in the relevant exchange rate can positively or negatively influence the value of the investment and the amount of the costs associated with the fund in the home currency.
We are not permitted to directly or indirectly offer, sell, transfer, or deliver this financial product to natural or legal persons whose place of residence or domicile is located in a country where this is legally prohibited. In this case, we may not provide any product information, either.
Please consult the corresponding information in the fund prospectus and the Information for Investors pursuant to § 21 AIFMG for restrictions on the sale of the fund to American or Russian citizens.
It is expressly noted that this communication does not provide any investment recommendations, but only expresses our current market assessment. Thus, this communication is not a substitute for investment advice.
This document does not represent a sales activity of the Management Company and therefore may not be construed as an offer for the purchase or sale of financial or investment instruments.
Erste Asset Management GmbH is affiliated with the Erste Bank and austrian Sparkassen banks.
Please also read the “Information about us and our securities services” published by your bank.