On 7 August, our Investment Committee convened for its monthly meeting. The month since the previous meeting on 7 July had been a positive one for investors willing to take risks. Thus, the optimistic risk stance of our team paid off in July. It is therefore not surprising that the team remains optimistic. In August, the risk stance is currently at 75% (previous month: 73%). This means that as a group, we are still optimistic. In terms of positioning, it means that we continue to prefer risky asset classes such as equities and corporate bonds.

Source: EAM
While the risk stance remained unchanged relative to the previous month, the internal structure of opinion inside the group had been shifting considerably. A few months ago, almost all team members were unanimously bullish. Meanwhile, this assessment has morphed into a bimodal distribution: one part of the team is very bullish, the other one is neutral. On aggregate, this results in a moderately bullish stance, but the underlying story is different – and the basis of an interesting discussion.
The conclusion is that as a team we remain optimistic and still prefer risky asset classes. As customary in the current stage of the cycle (late boom), the diversity of opinions in the team (in other words, the uncertainty) increases. The important message is that at this point nobody is risk-averse, i.e. more cautious than neutral in their positioning.
The market environment
In his presentation on the drivers of the economic status quo, Gerhard Winzer, our chief economist, pointed out a moderate improvement in the economic environment relative to the previous meeting.
- In the USA, the economy is still growing at a strong rate and clearly above potential. The fiscal impulses facilitated by the Trump cabinet have set the economy on a path towards overheating. The labour market is very tight, and the signs of moderate wage pressure are becoming more plentiful. Inflation is on the rise, but still moderately so.
- In Europe and Japan, the weakening experienced in the first half of the year has been absorbed: the growth expectations for the second half have not been subjected to any more negative revisions recently and are still above the potential growth estimated for the Eurozone in absolute terms. Also, at least the direct effects of a trade war with the USA have been avoided for the time being.
- In China, on the other hand, we have encountered a rising number of signs indicating economic weakness, but on a positive note, we have also seen reactions to these trends. The interest rates have been cut, the currency has depreciated, and a fiscal support package has been announced (the contents of which cannot be assessed at this point though). This brings about short-term support but does not change the fact that the question about China’s long-term growth model remains unanswered and any solution will have been made more difficult by these short-term measures.
Overall, we can say that in the USA the economy is firing on all cylinders, and while the rest of the world has experienced some weakening, it remains robust and is performing well in absolute terms. This scenario continues to suggest that risky asset classes can achieve good returns in the foreseeable future.
As always, we subjected this assessment to a critical evaluation in the following discussion, challenging it from various angles.
- As far as the decisive factors are concerned, the image is pretty much in line with the aforementioned scenario. Globally speaking, equities with small cap, value, and momentum exposure have underperformed in recent weeks – a performance pattern that generally fits a weaker global economy. At the same time, these patterns are still in their initial stages, which indicates a very moderate downturn as opposed to a slump.
- From our equity team’s point of view, the reporting season that has just come to an end is painting a similar picture. With the majority of figures in, we can see that US, European, and Japanese companies have reported very good quarterly results. Most companies exceeded earnings and sales estimates by analysts; however, US companies more so than European or Japanese ones.
| Index | Positive sales surprise | Positive earnings surprise |
| USA – S&P 500 | 70.54% | 83.45% |
| Europe – STOXX 600 | 60.84% | 52.34% |
| Japan – NIKKEI 225 | 58.56% | 61.74% |
Source: EAM
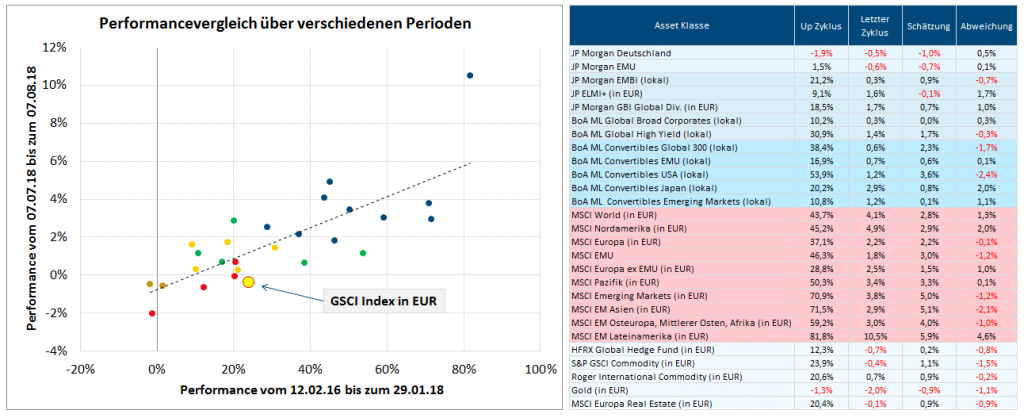
- The commodity markets have been sending signals that are at odds with our picture. Based on the GSCI index in EUR, commodities had lost about 0.4% since the previous meeting. Given the connection with the positive market phase since the beginning of 2016, the performance should have been positive in the past weeks. A closer analysis reveals the fact that cyclical commodities (industrial metals and energy) as well as gold had performed negatively. In the sub-segment of cyclical commodities, the energy outperformed industrial metals in relative terms. We interpret this fact as based on the recent weakening in China. This should come as a burden to cyclical commodities in general. The driving factors of the oil price are largely idiosyncratic: the new US sanctions imposed against Iran, the imminent IPO of Saudi Aramco, and the resulting production decline in Saudi Arabia support the oil price.
Source: EAM
What our discussion showed, in a nutshell, was that our picture pretty much fit the market movements in the previous weeks. The performance of commodities somewhat defies the overall positive picture. From our point of view, this strongly suggests that the markets are currently particularly uncertain about the situation in China and that a significant decline in economic growth cannot be ruled out.
Risk matrix
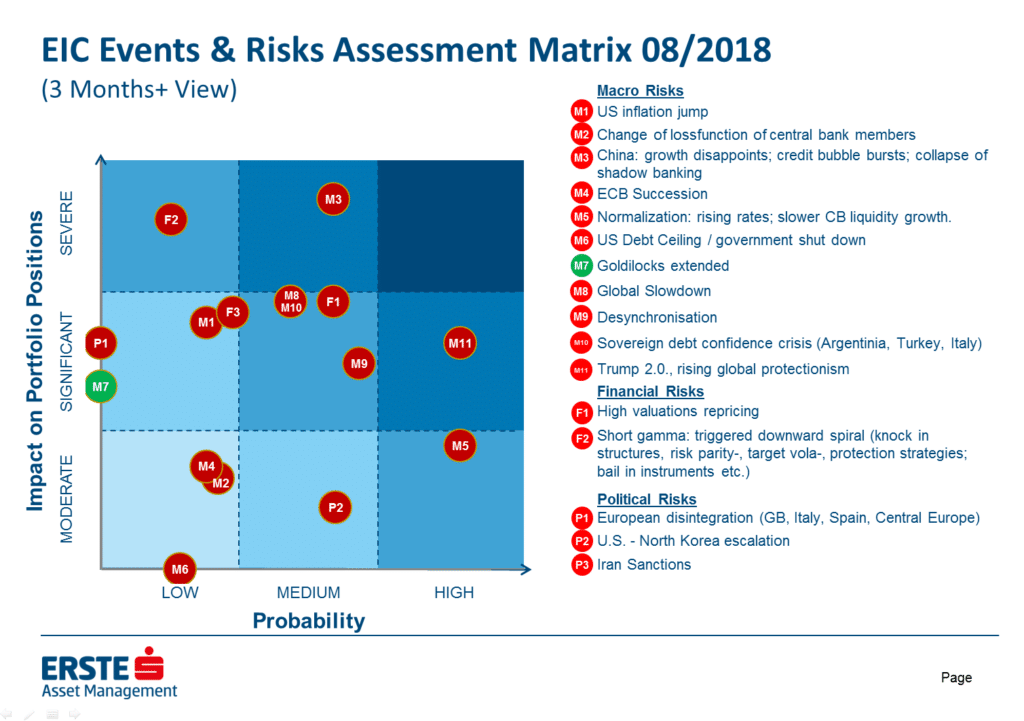
This brings us to the last point of our discussion, our risk assessment.
Source: EAM
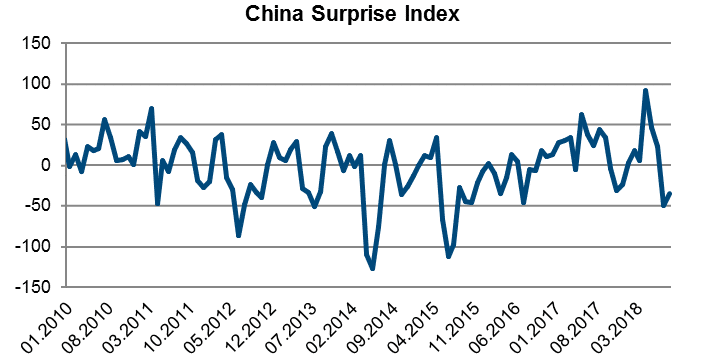
- As described above, we regard China as very big risk for the coming three months. The most recently published economic indicators suggest a downturn in economic growth. The Surprise Index for China, which reflects the degree to which positive economic indicators have recently surprised or disappointed, has fallen from a very high level at the beginning of 2018 to a meanwhile very low value. In other words, the Chinese indicators have turned massively within a short period of time.
Source: Citi Economic Surprise Indices
We believe that in addition to the still open question of what long-term growth model China can find and how it will ensure its transition to that model, cyclical uncertainties have re-emerged. China’s problem is that any short-term weakening of the markets will be construed as potentially heralding an imminent hard landing as long as it is unclear what path China will take in the long run. Therefore, negative data from China tend to rattle the markets. As pointed out earlier, the Chinese government has meanwhile tried numerous measures in an effort to support the economy with positive impulses. On aggregate, these measures will probably cause some tailwind for the economy; however, in the long run they do not reduce China’s worries but reinforce them, since the economy is drifting further and further away from “healthy” growth.
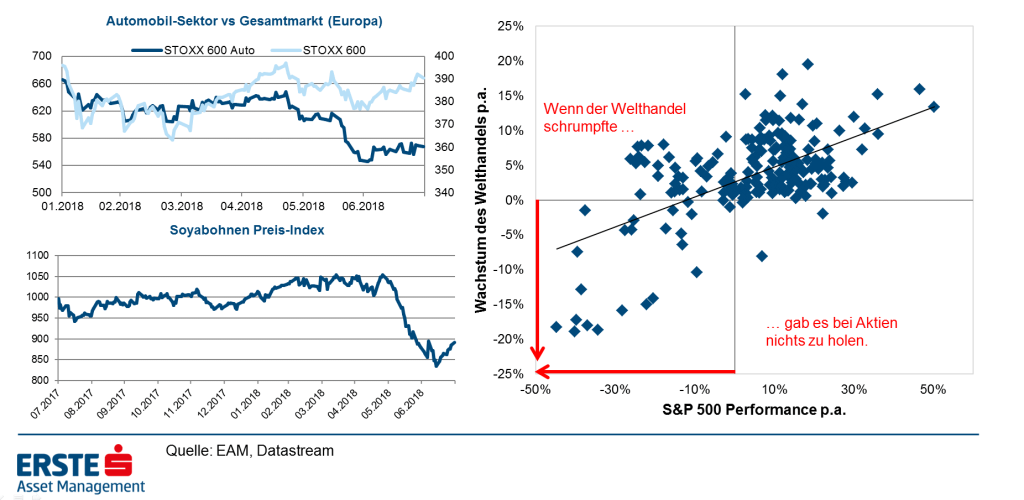
- The other big risk that we can see at the moment is the trade war between China and the USA. The agreement between EU Commission President Juncker and US President Trump had taken Europe out of the firing line. The markets are still unclear as to whether this agreement was based on a more conciliatory approach by Donald Trump (positive for the markets) or on a focus on the real enemy, China (negative for the markets). But this does not change the fact that on aggregate the topic is a burden for the market. In my opinion, this is due to a number of factors, as illustrated by the following chart.
Source: EAM
- The chart at the top left corner shows the share price performance of European car manufacturers relative to the overall market in the year to date. As you can see, the car manufacturers start underperforming moderately from March onwards. In May, the performance differential widened significantly over a few days. We think that this was due to the fact that the share prices of European car manufacturers were affected twice by the discussion about US tariffs. First, directly; tariffs on car imports are clearly negative for the respective companies. But in addition, car manufacturing today is based on a highly integrated, international just-in-time value and supply chain. Rising prices or obstructions in one area of the process have an impact on all areas and parties involved. The supply chain is only as strong as its weakest link. As a result, supply chains that are based on a high level of international integration in the automotive industry are particularly hard hit by barriers to trade.
- Second, trade wars always also come with unwanted side effects. The chart at the bottom left shows the development of soy prices. Soy is one of the products that China imports from the USA. It was definitely not US President Trump’s goal to harm “his” soy farms.
- The last point is reflected very clearly in the right chart. Since 2000, there has been a significant correlation between the performance of the equity market and the development of global trade volumes. The economic growth over the past 20 years has largely been based on the increasing degree of globalisation and integration of the global economy. If this development were to be reversed, it would harm the financial markets.
Legal note:
Prognoses are no reliable indicator for future performance.
Legal disclaimer
This document is an advertisement. Unless indicated otherwise, source: Erste Asset Management GmbH. The language of communication of the sales offices is German and the languages of communication of the Management Company also include English.
The prospectus for UCITS funds (including any amendments) is prepared and published in accordance with the provisions of the InvFG 2011 as amended. Information for Investors pursuant to § 21 AIFMG is prepared for the alternative investment funds (AIF) administered by Erste Asset Management GmbH pursuant to the provisions of the AIFMG in conjunction with the InvFG 2011.
The currently valid versions of the prospectus, the Information for Investors pursuant to § 21 AIFMG, and the key information document can be found on the website www.erste-am.com under “Mandatory publications” and can be obtained free of charge by interested investors at the offices of the Management Company and at the offices of the depositary bank. The exact date of the most recent publication of the prospectus, the languages in which the fund prospectus or the Information for Investors pursuant to Art 21 AIFMG and the key information document are available, and any other locations where the documents can be obtained are indicated on the website www.erste-am.com. A summary of the investor rights is available in German and English on the website www.erste-am.com/investor-rights and can also be obtained from the Management Company.
The Management Company can decide to suspend the provisions it has taken for the sale of unit certificates in other countries in accordance with the regulatory requirements.
Note: You are about to purchase a product that may be difficult to understand. We recommend that you read the indicated fund documents before making an investment decision. In addition to the locations listed above, you can obtain these documents free of charge at the offices of the referring Sparkassen bank and the offices of Erste Bank der oesterreichischen Sparkassen AG. You can also access these documents electronically at www.erste-am.com.
Our analyses and conclusions are general in nature and do not take into account the individual characteristics of our investors in terms of earnings, taxation, experience and knowledge, investment objective, financial position, capacity for loss, and risk tolerance. Past performance is not a reliable indicator of the future performance of a fund.
Please note: Investments in securities entail risks in addition to the opportunities presented here. The value of units and their earnings can rise and fall. Changes in exchange rates can also have a positive or negative effect on the value of an investment. For this reason, you may receive less than your originally invested amount when you redeem your units. Persons who are interested in purchasing units in investment funds are advised to read the current fund prospectus(es) and the Information for Investors pursuant to § 21 AIFMG, especially the risk notices they contain, before making an investment decision. If the fund currency is different than the investor’s home currency, changes in the relevant exchange rate can positively or negatively influence the value of the investment and the amount of the costs associated with the fund in the home currency.
We are not permitted to directly or indirectly offer, sell, transfer, or deliver this financial product to natural or legal persons whose place of residence or domicile is located in a country where this is legally prohibited. In this case, we may not provide any product information, either.
Please consult the corresponding information in the fund prospectus and the Information for Investors pursuant to § 21 AIFMG for restrictions on the sale of the fund to American or Russian citizens.
It is expressly noted that this communication does not provide any investment recommendations, but only expresses our current market assessment. Thus, this communication is not a substitute for investment advice.
This document does not represent a sales activity of the Management Company and therefore may not be construed as an offer for the purchase or sale of financial or investment instruments.
Erste Asset Management GmbH is affiliated with the Erste Bank and austrian Sparkassen banks.
Please also read the “Information about us and our securities services” published by your bank.

