
2017 was an excellent year for stocks. Developed markets were up more than 16% in local currencies, emerging markets almost 28%. In my previous column on global equities last November, after a couple of weeks of weaker markets and higher volatility, the conclusion was that “Both economic and earnings growth remain supportive, but moving into 2018, the momentum will be receding and new risks are emerging. There is further upside for equities, but a replay of the strong 2017 performance is improbable and the odds of a correction are clearly on the rise.”
Two months on, as new information has been coming in, it is time to revisit the outlook for 2018. Here are five charts, which show, how markets have developed since our last update and to what extent the verdict above still holds.
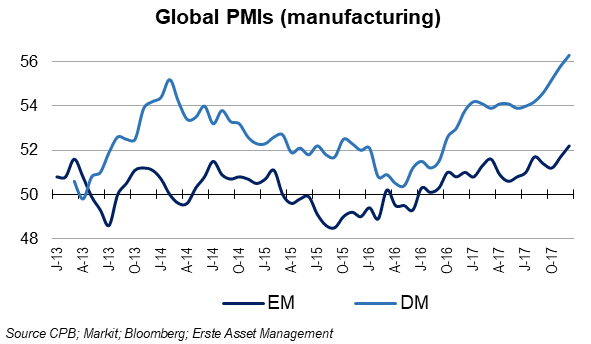
1. Economic growth remains supportive for equities: Economic growth is not showing any meaningful signs of deceleration. In the last two months of 2017, global PMI stayed well above the 50 point threshold (services) or even moved higher (manufacturing). The sell-side consensus forecast for global growth in 2018 has climbed to 3.7% in recent months, which is also in line with what the IMF expects. A particularly positive feature of the current upswing is the fact that it is broad-based – the world looks good everywhere – and (so far) non-inflationary. Even the US economy, which is already in a later stage of the cycle, will get another boost from the recent tax reform via its impact on business investment and consumption. While US and global growth will likely peak in 2018, recession risks are very low.
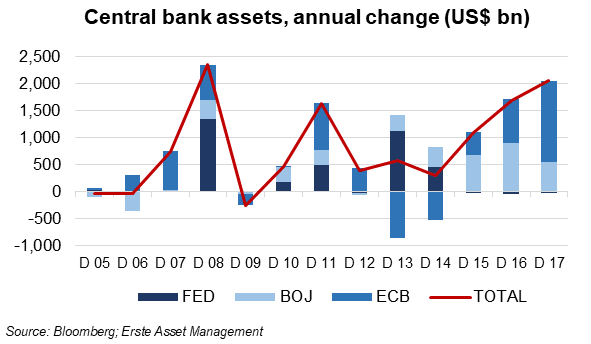
2. Monetary policy has been accommodative, but will become less so going forward. While the US central bank started reducing its balance sheet in the third quarter 2017, both the ECB and the Bank of Japan continue adding liquidity to the system. The total balance sheet of all three central banks combined will most likely still show moderate growth in 2018. Moreover, real policy rates remain in negative territory across the developed world. Thus, at least in the first half of 2018 monetary policy will most likely not have a negative impact on risky assets. This could change in the second half, when the ECB is supposed to stop quantitative easing and speculations about the bank’s next policy steps – balance sheet reduction, interest rate hikes – will move to the forefront.
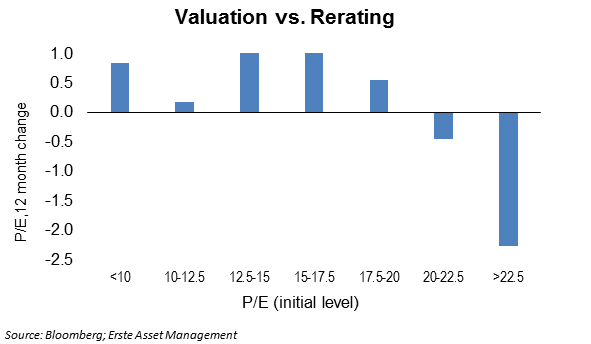
3. Don’t count on another year of multiple expansion. Equity markets are expensive. Maybe not as expensive as it seems[i], and also not that expensive relative to other asset classes such as bonds, but at face value most stock indices – particularly the US market – have been trading on elevated levels by historical standards for quite a while. It is well know, that valuation itself is rarely a trigger for a market reversal as long as fundamentals and sentiment provide support. However, the chart below indicates – based on US data since 1975 – that when the PE reaches 20x, US equities tend to de-rate on average over the following twelve months.
This is not an iron law, of course. Even when the PE was 22.5x or higher, in about a fifth of all cases, aggregate valuation continued climbing higher, but in the vast majority of cases and on average, a de-rating took place. With the trailing US PE presently hovering in the low 20s, the message is that investors who bet on a further multiple expansion may be up for a disappointment at the end of the year.
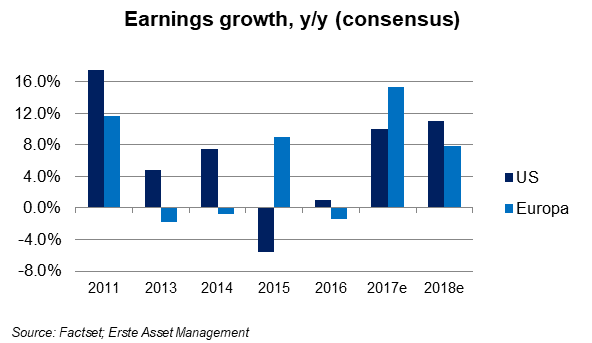
4. Positive earnings will be crucial for markets to maintain their momentum. After several years of disappointing earnings growth, companies delivered in 2017. In contrast to previous years, analysts’ earnings forecasts were raised during the year. An exception was Europe, where the strength of the common currency weighed on earnings. Still, earnings in Europe rose by about 15%. On the back of solid economic growth the outlook for 2018 is again positive. In addition, the recent tax-reform will impact US companies positively. Many broker estimates suggest that US earnings are getting a 6-10% boost from lower taxes.
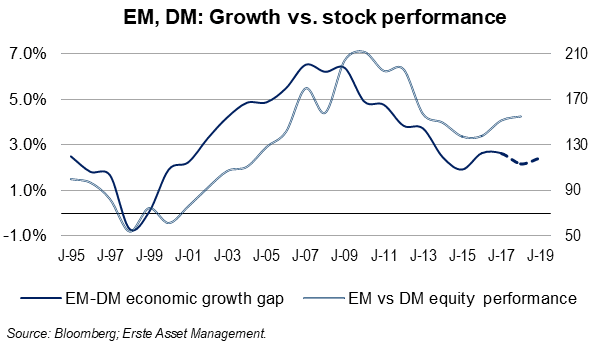
5. The outperformance of emerging markets could take a breather in 2018. One of the key factors determining the relative performance of equity markets in the emerging and the developed world is faster economic growth in the former. After 2010, for several years, the shrinking growth gap between emerging markets (EM) and developed markets (DM) contributed to a massive underperformance of EM equities. In the course of 2016, the growth gap began widening again and, subsequently, EM equities started outperforming their DM peers. This process was briefly interrupted by the election of President Trump and his anti-globalization agenda. However, in 2017 EM finally managed to outperform DM equities by c.10% (based on MSCI indices in local currencies).
A replication of this performance in 2018 is less likely though. While the outlook for EM economies is clearly positive, the developed world is also set to post solid economic growth this year. The EM-DM growth gap will remain broadly stable according to consensus. In addition, headwinds – at least for some emerging markets – will come from rising US rates, while at the same time the tailwinds from rising crude and metal prices will probably fade. If DM stocks indices continue climbing, EM will follow; nevertheless, a meaningful outperformance would be a surprise.
Bottom line: The fundamental backdrop remains positive for equities, at least in the first half of the year. Support is provided by buoyant global growth and a solid earnings outlook, but monetary policy normalization and the fact that growth will most likely peak sometimes during the year make it unlikely that 2018 will simply be a repeat of 2017 in terms of performance.
[i] For example, recently a group of McKinsey scholars argued that the aggregate valuation of the S&P 500 is distorted because “Four megacap companies—Amazon, Facebook, Google (Alphabet), and Microsoft—together valued at more than $2 trillion, account for 10 percent of the index and, as a group, trade at a PE ratio of 29. Excess cash among the remainder accounts for another $1.2 trillion. (The S&P 500’s total market capitalization at the time of this writing in December was $23.4 trillion.)”. Adjusting for these effects, according to the authors, lowers the S&P500’s earnings multiple to 16.9x, which looks pretty unexiting. https://www.mckinsey.com/business-functions/strategy-and-corporate-finance/our-insights/looking-behind-the-numbers-for-us-stock-indexes
Legal note:
Prognoses are no reliable indicator for future performance.
Legal disclaimer
This document is an advertisement. Unless indicated otherwise, source: Erste Asset Management GmbH. The language of communication of the sales offices is German and the languages of communication of the Management Company also include English.
The prospectus for UCITS funds (including any amendments) is prepared and published in accordance with the provisions of the InvFG 2011 as amended. Information for Investors pursuant to § 21 AIFMG is prepared for the alternative investment funds (AIF) administered by Erste Asset Management GmbH pursuant to the provisions of the AIFMG in conjunction with the InvFG 2011.
The currently valid versions of the prospectus, the Information for Investors pursuant to § 21 AIFMG, and the key information document can be found on the website www.erste-am.com under “Mandatory publications” and can be obtained free of charge by interested investors at the offices of the Management Company and at the offices of the depositary bank. The exact date of the most recent publication of the prospectus, the languages in which the fund prospectus or the Information for Investors pursuant to Art 21 AIFMG and the key information document are available, and any other locations where the documents can be obtained are indicated on the website www.erste-am.com. A summary of the investor rights is available in German and English on the website www.erste-am.com/investor-rights and can also be obtained from the Management Company.
The Management Company can decide to suspend the provisions it has taken for the sale of unit certificates in other countries in accordance with the regulatory requirements.
Note: You are about to purchase a product that may be difficult to understand. We recommend that you read the indicated fund documents before making an investment decision. In addition to the locations listed above, you can obtain these documents free of charge at the offices of the referring Sparkassen bank and the offices of Erste Bank der oesterreichischen Sparkassen AG. You can also access these documents electronically at www.erste-am.com.
Our analyses and conclusions are general in nature and do not take into account the individual characteristics of our investors in terms of earnings, taxation, experience and knowledge, investment objective, financial position, capacity for loss, and risk tolerance. Past performance is not a reliable indicator of the future performance of a fund.
Please note: Investments in securities entail risks in addition to the opportunities presented here. The value of units and their earnings can rise and fall. Changes in exchange rates can also have a positive or negative effect on the value of an investment. For this reason, you may receive less than your originally invested amount when you redeem your units. Persons who are interested in purchasing units in investment funds are advised to read the current fund prospectus(es) and the Information for Investors pursuant to § 21 AIFMG, especially the risk notices they contain, before making an investment decision. If the fund currency is different than the investor’s home currency, changes in the relevant exchange rate can positively or negatively influence the value of the investment and the amount of the costs associated with the fund in the home currency.
We are not permitted to directly or indirectly offer, sell, transfer, or deliver this financial product to natural or legal persons whose place of residence or domicile is located in a country where this is legally prohibited. In this case, we may not provide any product information, either.
Please consult the corresponding information in the fund prospectus and the Information for Investors pursuant to § 21 AIFMG for restrictions on the sale of the fund to American or Russian citizens.
It is expressly noted that this communication does not provide any investment recommendations, but only expresses our current market assessment. Thus, this communication is not a substitute for investment advice.
This document does not represent a sales activity of the Management Company and therefore may not be construed as an offer for the purchase or sale of financial or investment instruments.
Erste Asset Management GmbH is affiliated with the Erste Bank and austrian Sparkassen banks.
Please also read the “Information about us and our securities services” published by your bank.