The US presidential election on 5 November comes with numerous socio-political aspects. At this point, we want to look only at the consequences for investors and the standing of the USA in the economic world today.
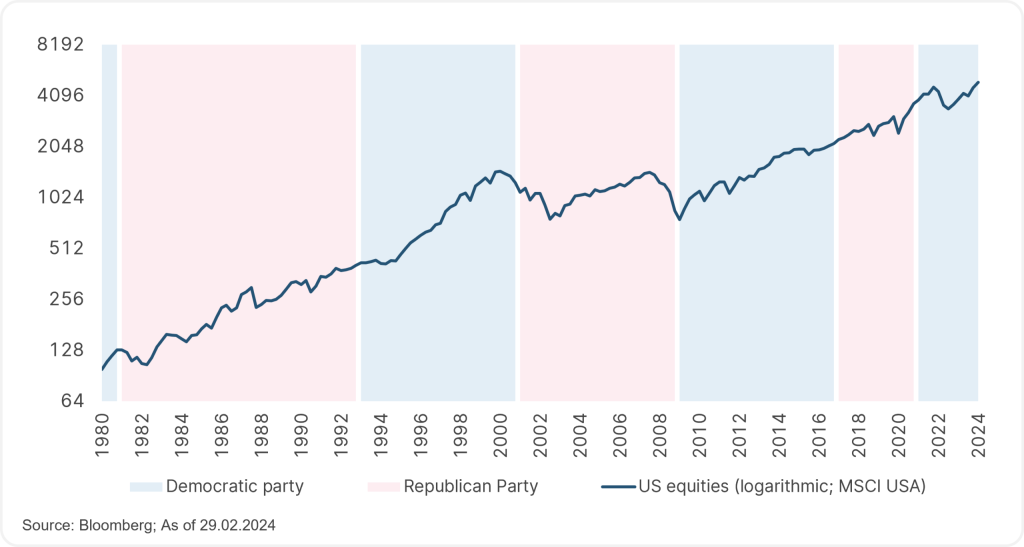
There are different ways to approach the question of what impact a Democratic or Republican presidential candidate has had or will have on equity market prices from 2025 onwards. If you take the helicopter perspective and look at the performance of US equities as a whole, i.e. without looking at individual economic sectors, for example, we find that only little stands out. The successful development, plotted here over 45 years, has been little affected by the political situation:
Please note: Past performance is no reliable indicator of future value development.
Performance of US shares 1980-2024
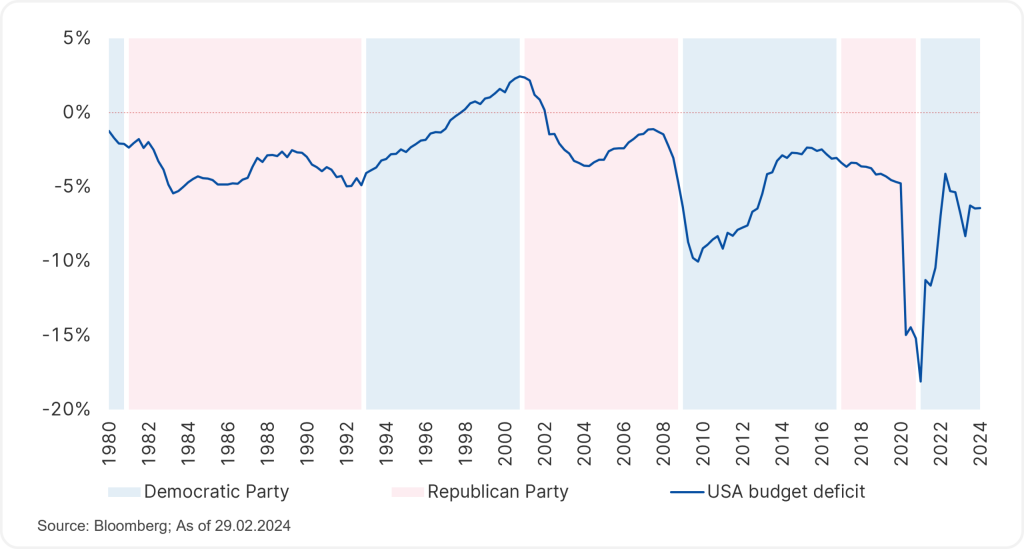
Looking at the national budget, on the other hand, we can see that a budget surplus has only been achieved once – around 1997-2002, mainly during the Bill Clinton years. Since then, the budget has shown a certain downward trend, intensified in the financial crisis of 2008/09 and the Covid crisis of 2020/21, when government support measures were necessary. The situation has gradually worsened to a current budget deficit of around 6.3%.
National budget USA 1980-2024
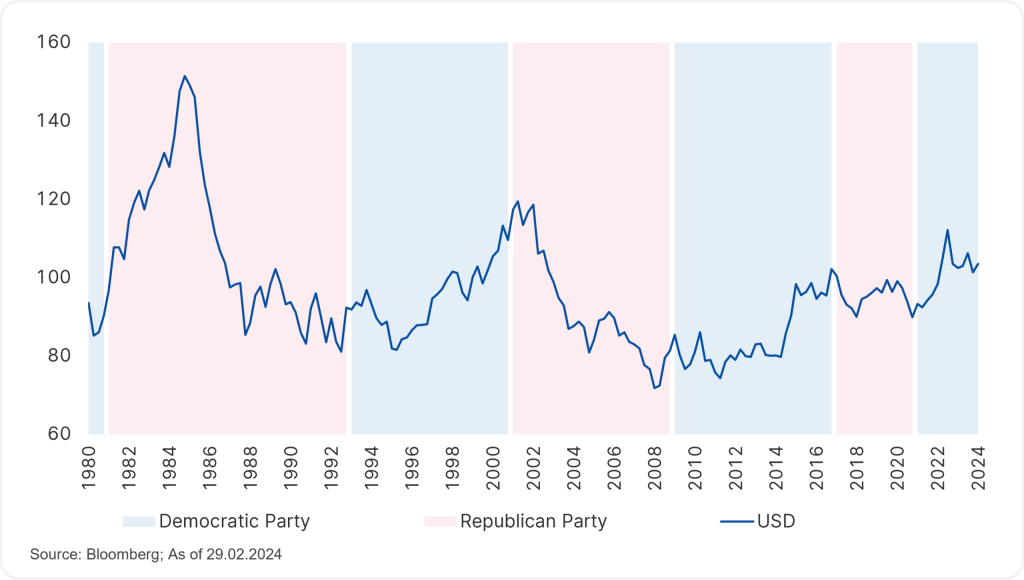
The development of the US dollar in comparison to other currencies, such as the euro, is also interesting. A strong currency is not exclusively, but to a large extent, an expression of a country’s strong competitive position. This means that a phase of strength in a currency is usually followed by a dip, as the exchange rates are trying to establish an equilibrium between the currency areas via export and import prices.
US dollar performance 1980-2024
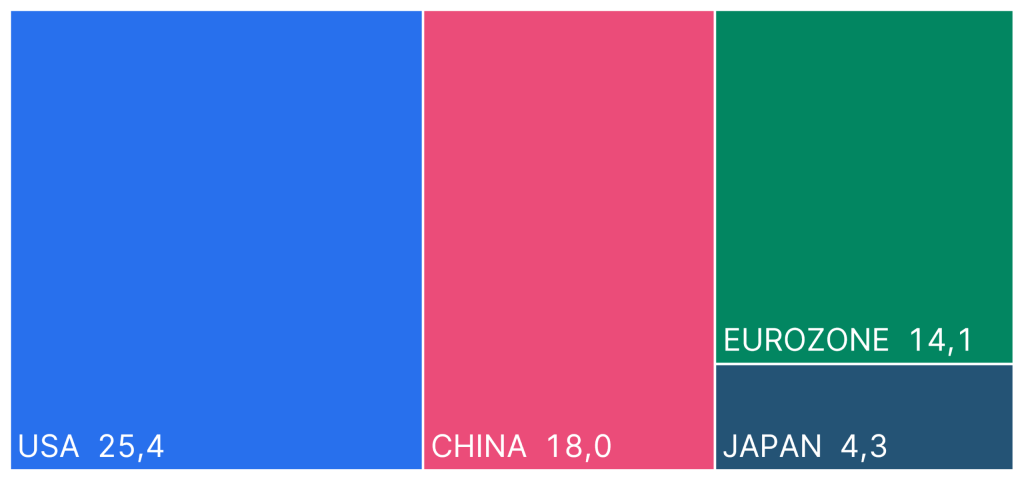
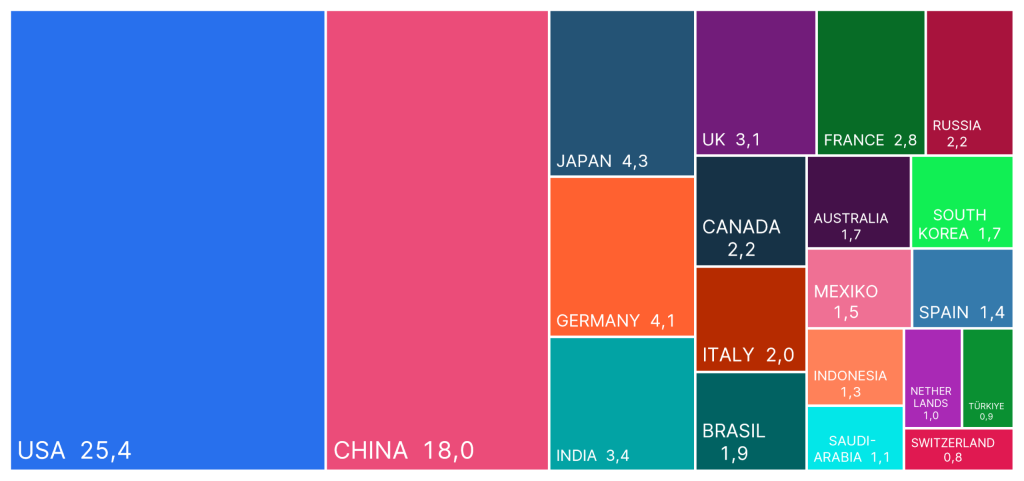
Just a few years ago, forecasts suggested that China would surpass the US in terms of economic output within a foreseeable period of time. However, this is no longer the case today. Growth in China has slowed down on the back of decreased demographic momentum (the population pyramid has been shifting in favour of the older age groups). The real estate sector in particular, which was a humming growth engine for a long time, is now facing saturated demand. The movement from rural areas to the cities is already well advanced.
Comparative economic output (in 1,000 US-Dollar bn)
It is also interesting to look at the countries in Europe individually. Japan, Germany, and India are roughly comparable in terms of economic output, as are the UK and France, for example.
Comparative economic output (in 1,000 US-Dollar bn)
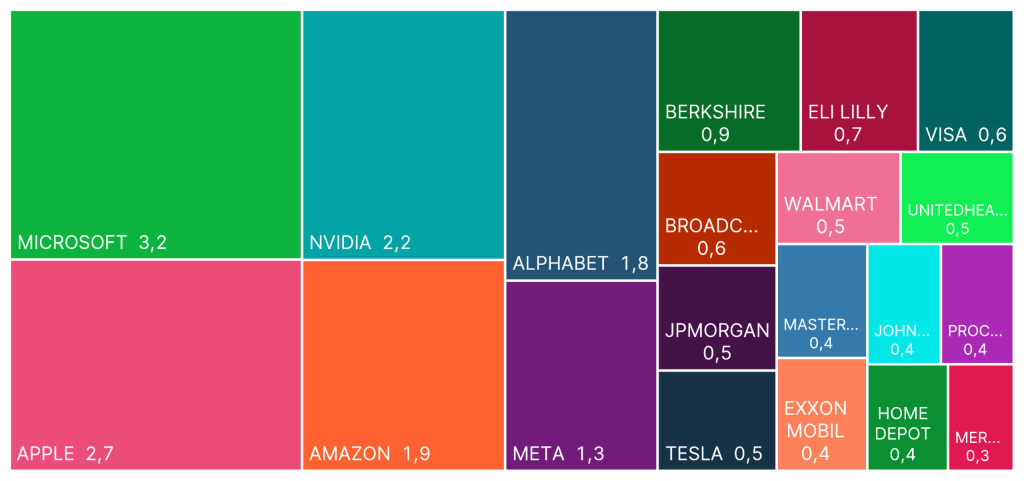
The question of what has made and continues to make the USA so successful can easily be answered by looking at the companies with the largest market capitalisation: technology. Microsoft, Apple, the computer chip manufacturer NVIDIA, Amazon, Meta, Alphabet,… are a manifestation of the fact that a massive part of the world’s economic output takes place online or in the form of electronic products, and is largely supplied by US companies. The use of artificial intelligence will only reinforce this.
The 20 largest listed companies USA (in 1,000 USD bn)
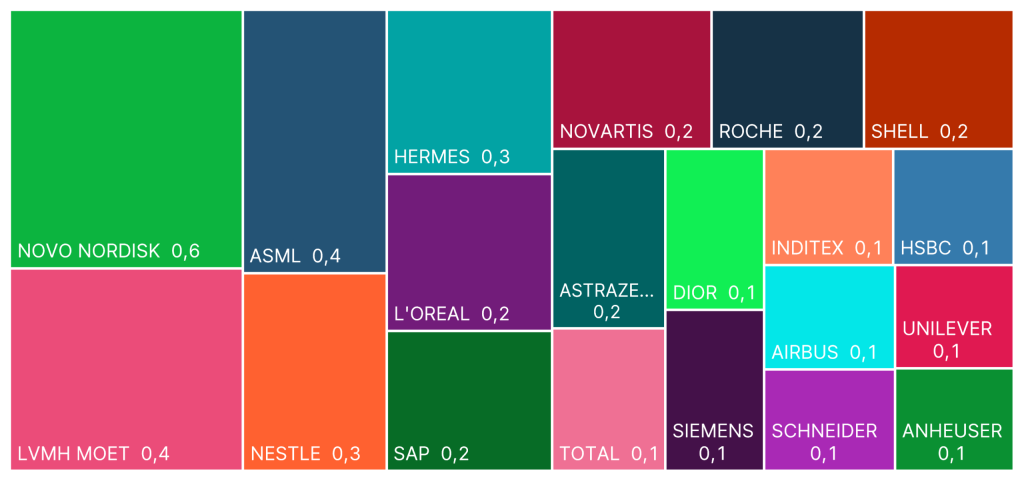
By contrast, the composition of the comparable European companies with the highest market capitalisation is somewhat different. Although the computer chip manufacturer ASML and the software company SAP are also among them, the proportion of traditional consumer goods manufacturers, some of them in the luxury segment, is higher. Novo Nordisk, a company that has been a leader in the pharmaceutical sector for a short time, is very successful in the development of therapies and active ingredients.
The 20 largest listed companies in Europe (in 1,000 USD bn)
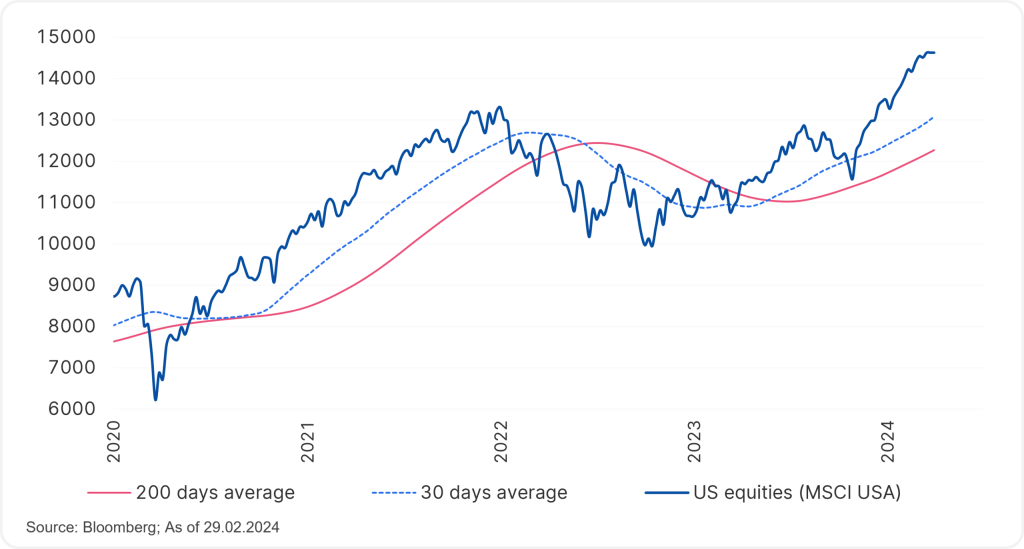
Either way, US equities are now performing strongly again and have overcome the negative phase of 2022, when the fight against extreme inflation made it inevitable to raise lending rates and thus dampen the economy.
Please note: Past performance is no reliable indicator of future value development.
Performance of USA equities 2020-2024
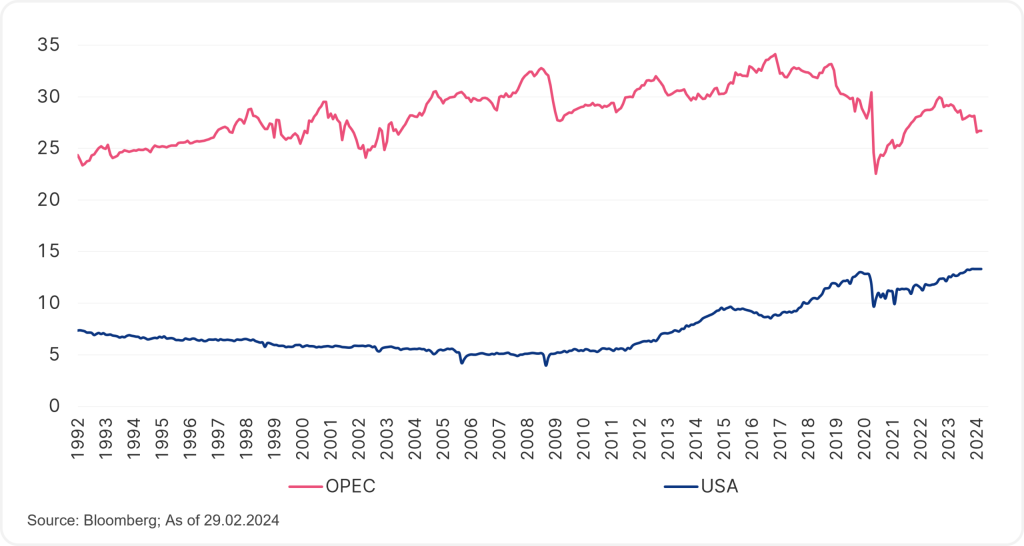
One aspect from which the USA benefits greatly is its independence in the energy sector, i.e. oil and natural gas. Europe has been singing a very different, painful tune about this in recent years. The following chart shows OPEC’s crude oil production: it has been in decline since around 2018 and has recently been subject to further cutbacks. By contrast, the USA is producing record quantities of crude oil and can add more volume than OPEC is currently taking off the market, thereby stabilising prices on the global market.
Comparative crude oil production (in million barrels per day)
Are there any negative aspects among all of these? As mentioned at the beginning, this article ignores geopolitical and socio-political aspects, a plethora of which the presidential election certainly holds. The favourable stock market trend, on the other hand, could at best be interrupted by a recession. The reason for this would be that although the exceptionally rapid rise in lending rates had already dampened the economy, the full impact would not be felt until 2024 or 2025.
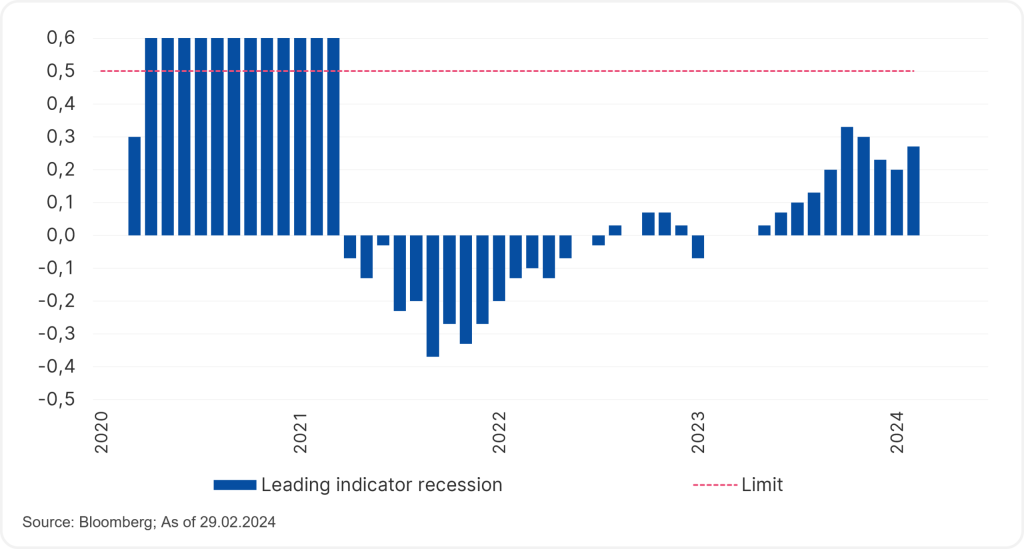
Forecasting recessions is notoriously difficult. One leading indicator is the “Sahm rule”, named after an employee of the US Federal Reserve. This rule measures the rise in unemployment. A sudden rise was previously a reliable indication of an impending recession. The chart shows that the indicator was already close to the threshold in October 2023, then developed favourably for a few months and rose again with the February 2024 value. It is therefore worth keeping an eye on the trend.
Leading recession indicator for the USA 2020-2024
Conclusion
The impact of this year’s US presidential election on the stock markets is likely to remain contained. Investors who invest broadly in equities on a global scale – for example with the CORE Equities fund – hold a US allocation of around two thirds in their fund and can benefit personally from the economic strength of the USA.
As an index-tracking fund, CORE Equities invests in a benchmark index. This index represents the performance of the 120 largest shares of companies from the USA, the Eurozone, the UK, Switzerland, and Japan. Sustainability criteria are also taken into account in the investment decision.
Please note: investing in securities involves risks as well as opportunities.
Notes CORE Equities
The discretionary selection of assets permitted for the investment fund is limited. The fund employs a passive investment policy and the scope of discretion of the management company is limited. The investment fund is a user within the meaning of Regulation (EU) 2016/1011 (Reference Assets Regulation). Please note that investing in securities also involves risks besides the opportunities described.
For further information on the sustainable focus of CORE Equities as well as on the disclosures in accordance with the Disclosure Regulation (Regulation (EU) 2019/2088) and the Taxonomy Regulation (Regulation (EU) 2020/852), please refer to the current Prospectus, section 12 and the Annex “Sustainability Principles”. In deciding to invest in CORE Equities, consideration should be given to any characteristics or objectives of the CORE Equities as described in the Fund Documents.
Legal disclaimer
This document is an advertisement. Unless indicated otherwise, source: Erste Asset Management GmbH. The language of communication of the sales offices is German and the languages of communication of the Management Company also include English.
The prospectus for UCITS funds (including any amendments) is prepared and published in accordance with the provisions of the InvFG 2011 as amended. Information for Investors pursuant to § 21 AIFMG is prepared for the alternative investment funds (AIF) administered by Erste Asset Management GmbH pursuant to the provisions of the AIFMG in conjunction with the InvFG 2011.
The currently valid versions of the prospectus, the Information for Investors pursuant to § 21 AIFMG, and the key information document can be found on the website www.erste-am.com under “Mandatory publications” and can be obtained free of charge by interested investors at the offices of the Management Company and at the offices of the depositary bank. The exact date of the most recent publication of the prospectus, the languages in which the fund prospectus or the Information for Investors pursuant to Art 21 AIFMG and the key information document are available, and any other locations where the documents can be obtained are indicated on the website www.erste-am.com. A summary of the investor rights is available in German and English on the website www.erste-am.com/investor-rights and can also be obtained from the Management Company.
The Management Company can decide to suspend the provisions it has taken for the sale of unit certificates in other countries in accordance with the regulatory requirements.
Note: You are about to purchase a product that may be difficult to understand. We recommend that you read the indicated fund documents before making an investment decision. In addition to the locations listed above, you can obtain these documents free of charge at the offices of the referring Sparkassen bank and the offices of Erste Bank der oesterreichischen Sparkassen AG. You can also access these documents electronically at www.erste-am.com.
Our analyses and conclusions are general in nature and do not take into account the individual characteristics of our investors in terms of earnings, taxation, experience and knowledge, investment objective, financial position, capacity for loss, and risk tolerance. Past performance is not a reliable indicator of the future performance of a fund.
Please note: Investments in securities entail risks in addition to the opportunities presented here. The value of units and their earnings can rise and fall. Changes in exchange rates can also have a positive or negative effect on the value of an investment. For this reason, you may receive less than your originally invested amount when you redeem your units. Persons who are interested in purchasing units in investment funds are advised to read the current fund prospectus(es) and the Information for Investors pursuant to § 21 AIFMG, especially the risk notices they contain, before making an investment decision. If the fund currency is different than the investor’s home currency, changes in the relevant exchange rate can positively or negatively influence the value of the investment and the amount of the costs associated with the fund in the home currency.
We are not permitted to directly or indirectly offer, sell, transfer, or deliver this financial product to natural or legal persons whose place of residence or domicile is located in a country where this is legally prohibited. In this case, we may not provide any product information, either.
Please consult the corresponding information in the fund prospectus and the Information for Investors pursuant to § 21 AIFMG for restrictions on the sale of the fund to American or Russian citizens.
It is expressly noted that this communication does not provide any investment recommendations, but only expresses our current market assessment. Thus, this communication is not a substitute for investment advice.
This document does not represent a sales activity of the Management Company and therefore may not be construed as an offer for the purchase or sale of financial or investment instruments.
Erste Asset Management GmbH is affiliated with the Erste Bank and austrian Sparkassen banks.
Please also read the “Information about us and our securities services” published by your bank.


