
Predictions are hard, especially about the future. And even more so about the future far out. But this may not hold true everywhere. In fixed income, for example bonds, forecasting the future return over the next 10 years may be easier than forecasting the return for next year.
Rising yields – falling prices
What may seem counterintuitive at first has a simple mathematical logic behind it. Namely the inverse relationship between yields and prices. Rising yields lead to falling prices, and vice versa: when yields fall, bond prices rise.
How easy it is to predict the return can be illustrated by a simple example: Assume we bought a bond for 100 with a coupon of 4% and a maturity of 10 years. If we simply do nothing over the next 10 years and the bond is redeemed, we would have earned an average return of 4% a year. Pretty easy to forecast the return, right? But it gets a little bit more complicated if we re-invest the coupon payments and even more complicated if we sell the bond and buy another one. It gets even trickier to forecast the return over a 10-year horizon if we hold a bond portfolio. From step to step we get more and more exposed to changes in interest rates.
Higher coupons and redemptions counteract price losses
Assume one has a relatively safe portfolio of bonds with a duration held constant over time. If yields rise the bond portfolio will see a fall in prices. However, we could reinvest the coupons and the redemption received at higher yields. But how good do these two effects offset each other over a 10-year horizon? The surprising answer: pretty good! This is one reason why one of the simplest forecasting models for future fixed income returns for a 10-year period relies solely on the yield.
10-year return higher than yield
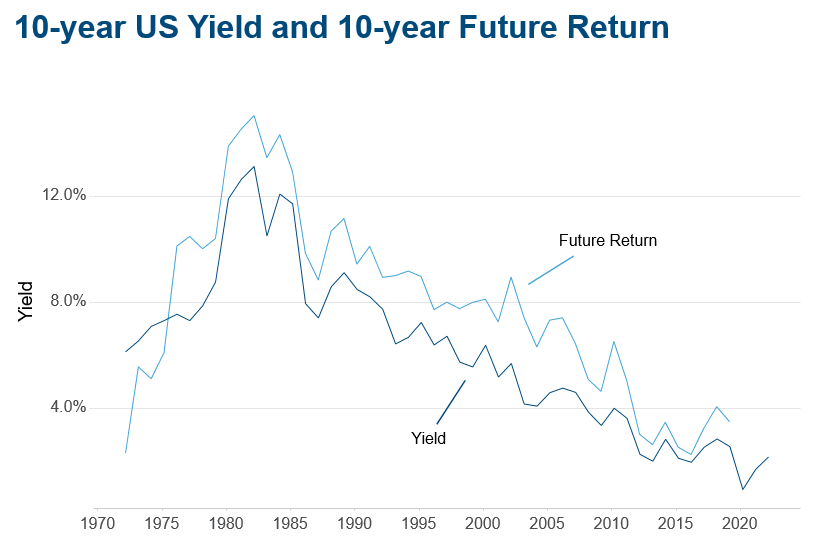
We will start with a short analysis on the 10-year US Treasury. The graph shows the yield and the 10-year future return of it. The plot should be read as follows: Assuming we are in the year 2000, we can observe an interest rate of 6.4%. The 10-year return from 2000-2010 would be the point on the upper line and is around 8%.
Some interesting facts can be observed. First, for nearly the past 40 years, with exception of the most recent past, we have experienced a trend of falling yields. Second, the 10-year rate and the future return move in a very similar way and seem to be highly correlated. Another point worth highlighting is that the 10-year future return has been higher than the 10-year yield. This can be explained by the fact that investors made windfall capital gains from the falling yield trend.
Note: Past performance is not a reliable indicator for future performance of an investment.
Return Components: coupon and price changes
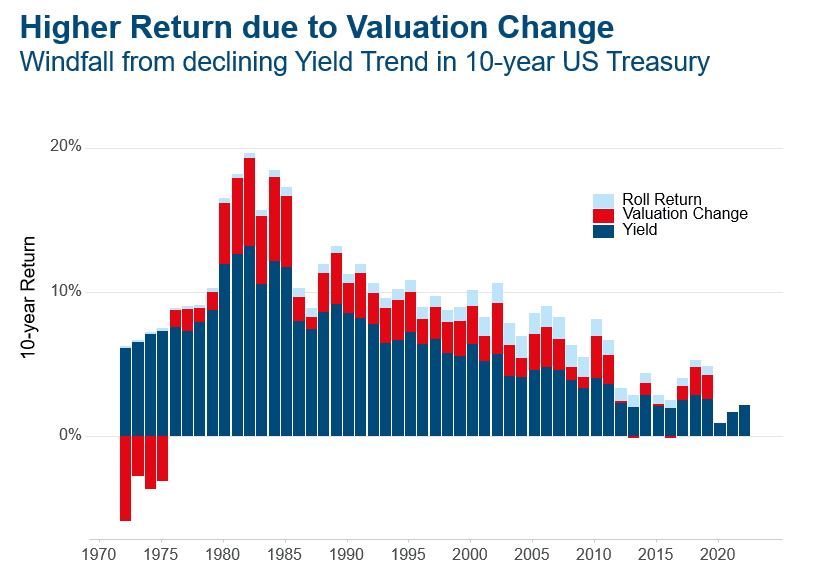
It is interesting to dig a bit deeper into the mechanics of this. In fixed income one has two major sources of return. One is the coupon (cash flows) the instrument is paying, and the other source is price gains of the instrument itself.
Price gains can further be composed. First, into the “roll-down” effect. This describes that, for example, a bond with a maturity of 10 years will only have a maturity of 9 years in one year. The price of the bond changes naturally and this is called “roll-down” effect since one “rolls-down” the yield curve. The other component in the price return source is due to the level change of the yield curve. When yields are falling, prices are rising and vice versa. The graph shows the breakdown of the 10-year return: between 1980 and 2010 the valuation change (capital gains from falling yields) played a prominent role and led to the above 10-year rate return.
Note: Past performance is not a reliable indicator for future performance of an investment.
10-year return compared to yields
Sometimes one must look backwards to understand the future. A model is only as good as the data which it is fed with. Moreover, the explanations given so far put the model into context and give some background on how the results should be interpreted as this model is quite commonly found in research papers.
The model is a simple regression model: the future 10-year return is estimated with the current yield. We first apply it to the 10-year US and German Bunds.
The graph below shows the result of such a regression: as expected, the relation is very strong, and the yield can explain more than 95% of the variation of the 10-year future return. The coefficients are around 1.2 for both markets. This tells us that when we observe a yield of 2 percent it expects a 10-year return of 2.4 percent (2 * 1.2). The model expects a return greater than the actual yield because of the bias of falling yields in the data and has already been worked out comprehensively in the paragraphs above.

Note: Past performance is not a reliable indicator for future performance of an investment.
Now that the foundation has been laid, the regression model has been estimated for various market segments of the US and German government bonds. For a market weighted average of US Treasuries as well as for German Bunds the coefficient is a bit lower at around 1.07. This is because capital gains at the lower maturities are less than for bonds which are longer dated. But still, the model expects a slightly higher 10-year future return for the overall Treasuries and Bund market compared to the yield.
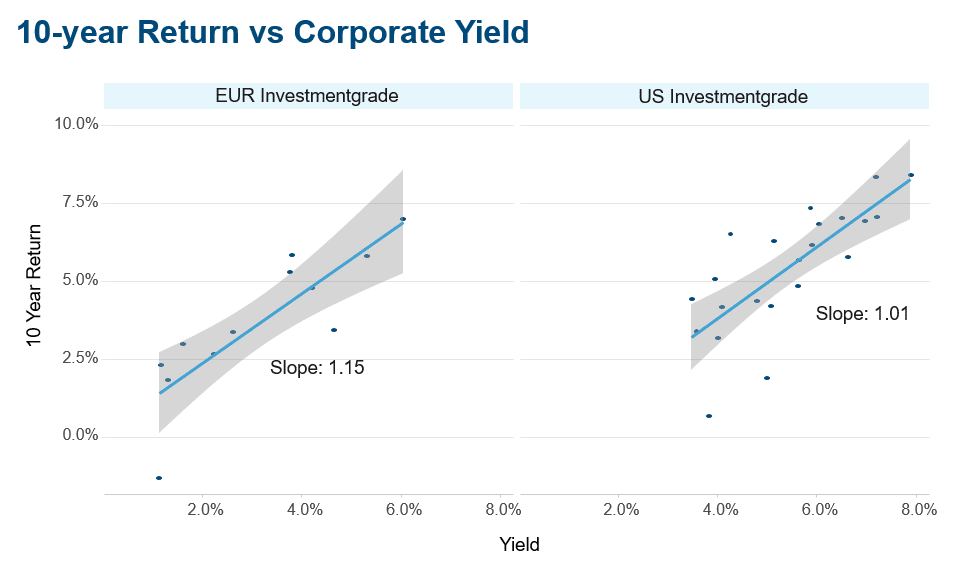
Since we already started exploring different government segments, let us move to the corporate sector. Without going to much into detail, the key findings are: first, the model does not work here as good as for government bonds. This is because the spread component, potential downgrades and defaults play a role in the return calculation. In addition, the data history is not as extensive as for the government segment which leads to possible distortions.
The following graph shows the regression for investment grade in Dollar and Euro. Still, the yield explains around 85% of the future return and the coefficient is slightly above one for both markets. One explanation may be that the rate component for investment grade plays a more important role than the spread component. The picture is different for the high yield segment where the relationship is close to collapsing. This may be because the spread development and defaults are more prominent contributors to the return than the development of general rates levels.
Note: Past performance is not a reliable indicator for future performance of an investment.
Conclusion
Keep it simple! One credo in machine learning is, when faced with multiple models which give equally good results, choose the simplest one. And it is hard to find a simpler model than the one presented above. Moreover, it works extremely well for government bonds, acceptable good for corporate investment grade and only fails for high yield bonds. Besides this, the intuition behind the model and the interpretation of the coefficients are straight forward.
Nevertheless, caution is advised: going forward, the model may be overestimating the future return in the given yield environment. However, the relationship between yield and 10-year future return is strong. So, with good conscience it can be expected to earn the yield over a longer horizon.
For a glossary of technical terms, please visit this link: Fund Glossary | Erste Asset Management
Legal note:
Prognoses are no reliable indicator for future performance.
Please note that an investment in securities also entails risks in addition to the opportunities described.