
The stable share performance since the beginning of the year experienced a certain, limited setback from the end of March. This raises the question of whether such turning points in the market can be read off the data in advance. Obviously there are no one hundred percent indicators, but there are various approaches.
Momentum US equities
The markets have been momentum-driven since the beginning of the year. This means that prices have risen steadily without new, positive news constantly arriving. The disadvantage of momentum is that it tends to end unexpectedly and suddenly.
Momentum can be measured in different ways, e.g. using so-called autocorrelation. A “tangible” measure is the performance of the last 4 months. This shows that the 2024 momentum of the equity rally (the red line in the chart) reached a historical peak:
Note: Past performance is not a reliable indicator of future performance. Investments in securities entail risks in addition to the opportunities. Representation of an index, no direct investment possible.

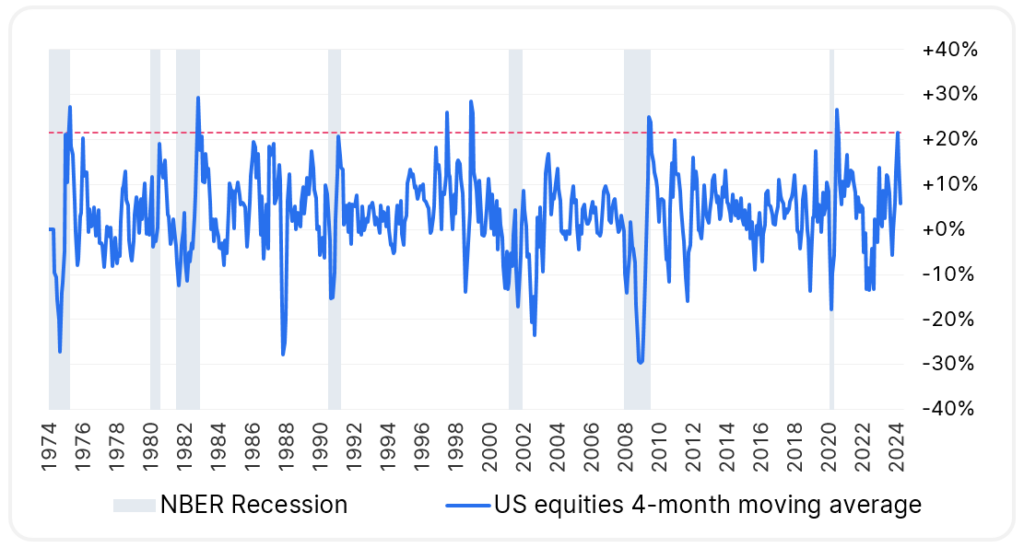
Source: Bloomberg; Erste AM Multi_Asset_Chartbook; presentation of US Equities based on MSCI USA
Equity share of active managers
A second measure is the equity exposure index of the market participants grouped in the Association of Active Investment Managers. The index basically has a range of 0-100% (plus leverage where applicable). If the index reaches 100% (the red line in the chart), the managers are already fully invested. This has not often been achieved in recent years. This can therefore be a further indicator of a turning point.
Note: Past performance is not a reliable indicator of future performance. Investments in securities entail risks in addition to the opportunities. Representation of an index, no direct investment possible.

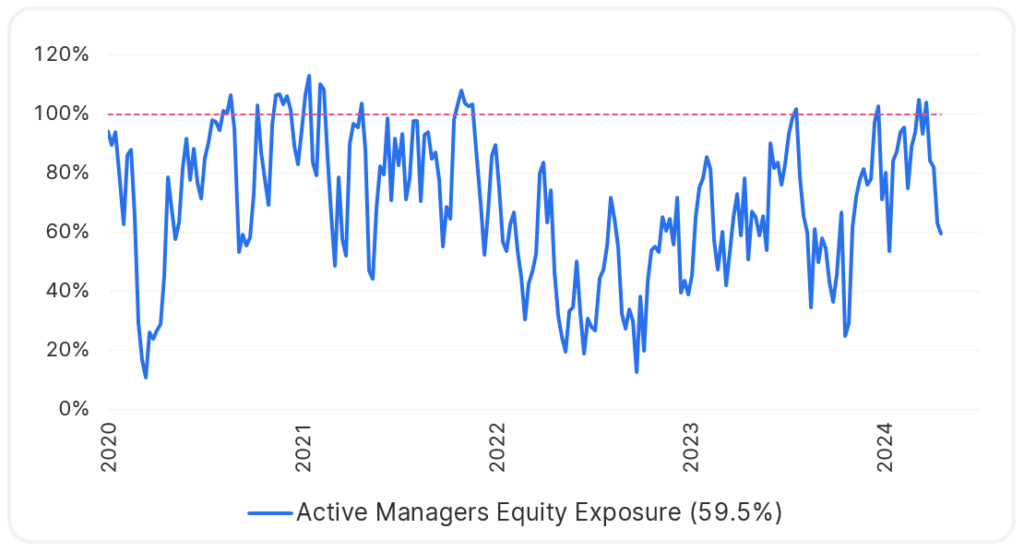
Source: Bloomberg; Erste AM Multi_Asset_Chartbook
Inversion VIX futures
The so-called inversion of VIX futures is somewhat more complex. The VIX measures the volatility of the stock markets – a sharp rise in the VIX indicates a crisis. The VIX can be invested in via associated futures, which are available in various maturities.
An inversion occurs when the immediate future rises in price more than the next longest future – because this signals that volatility and “fear” are rising selectively and immediately. The following chart shows that this condition is fulfilled in April (the blue line crosses below the red line):
Note: Past performance is not a reliable indicator of future performance. Investments in securities entail risks in addition to the opportunities. Representation of an index, no direct investment possible.

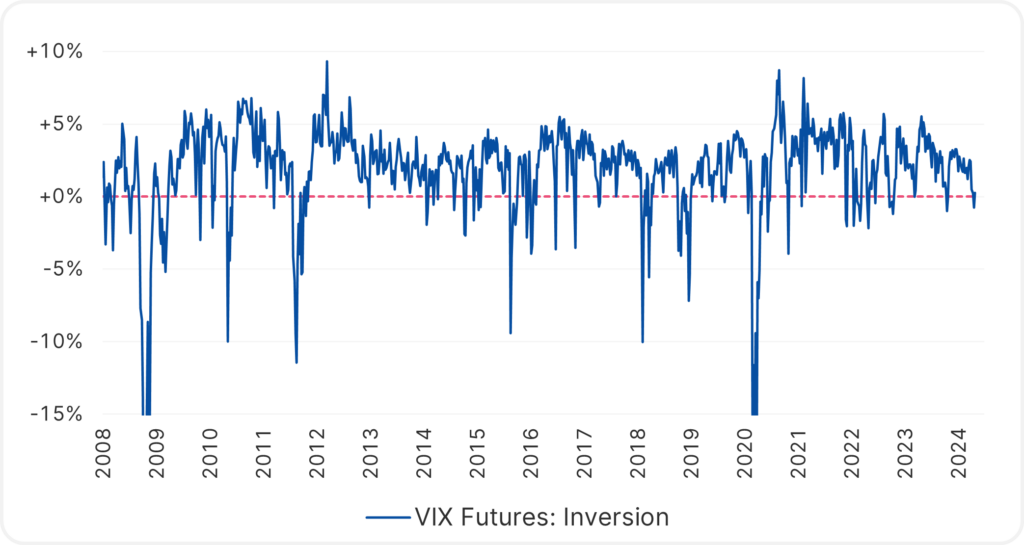
Source: Bloomberg; Erste AM Multi_Asset_Chartbook
Financial outlook US companies
In the medium and long term, share prices are in line with corporate earnings and the earnings outlook. The following chart shows an evaluation that measures whether the outlook of companies currently going public has improved or deteriorated. Now “improvement” or “deterioration” is not an exact science, but the ratio may be meaningful. The ratio has worsened since around the beginning of the year (red area):

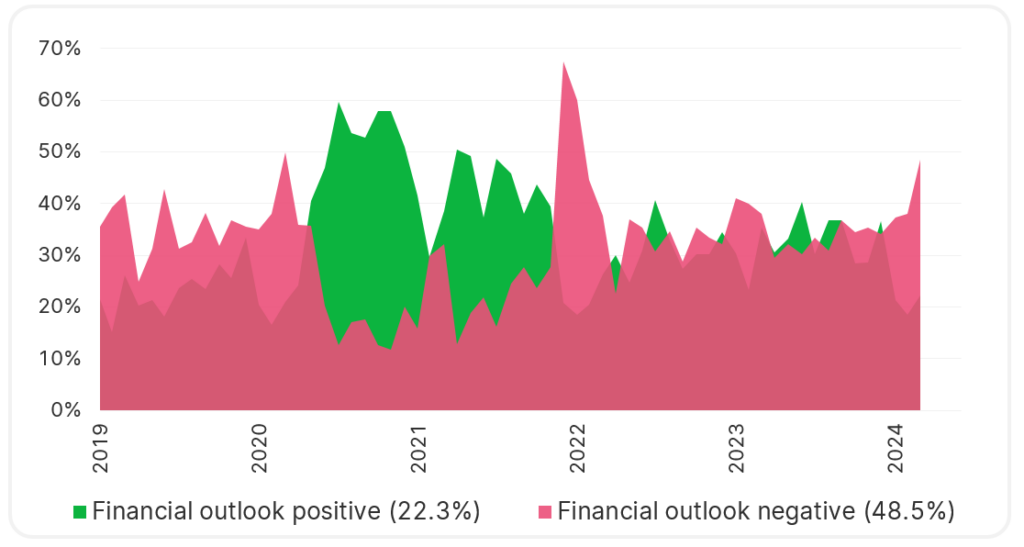
Source: Bloomberg; Erste AM Multi_Asset_Chartbook
Cyclical indicators
Common short-term indicators can be used: The ratio of defensive to cyclical stocks (defensive stocks perform relatively better in a crisis); the US dollar (tends to show strength when equity markets are under pressure); and the credit risk premium on corporate bonds (US BBB spread). They are plotted on the following chart:
Note: Past performance is not a reliable indicator of future performance. Investments in securities entail risks in addition to the opportunities. Representation of an index, no direct investment possible.

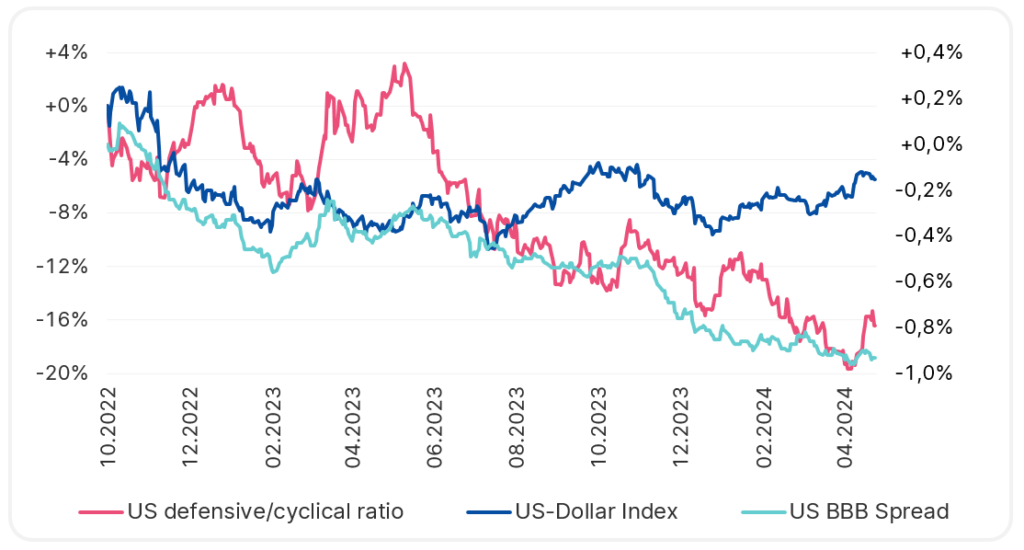
Source: Bloomberg; Erste AM Multi_Asset_Chartbook
Loss phases for equities, monthly data
However, these values are more descriptive than predictive. Stress can be read, but not predicted.
Every losing phase in equities ends – ideally, the starting point would have been used for a reduction in order to take advantage of the opportunity for a re-entry. The following chart shows these drawdowns: massive loss phases such as those from 2000 onwards and the 2008 financial crisis alternate with more limited fluctuations. For “normal” drawdowns, a range of -10% to -20% may indicate a certain lower limit:
Note: Past performance is not a reliable indicator of future performance. Investments in securities entail risks in addition to the opportunities. Representation of an index, no direct investment possible.
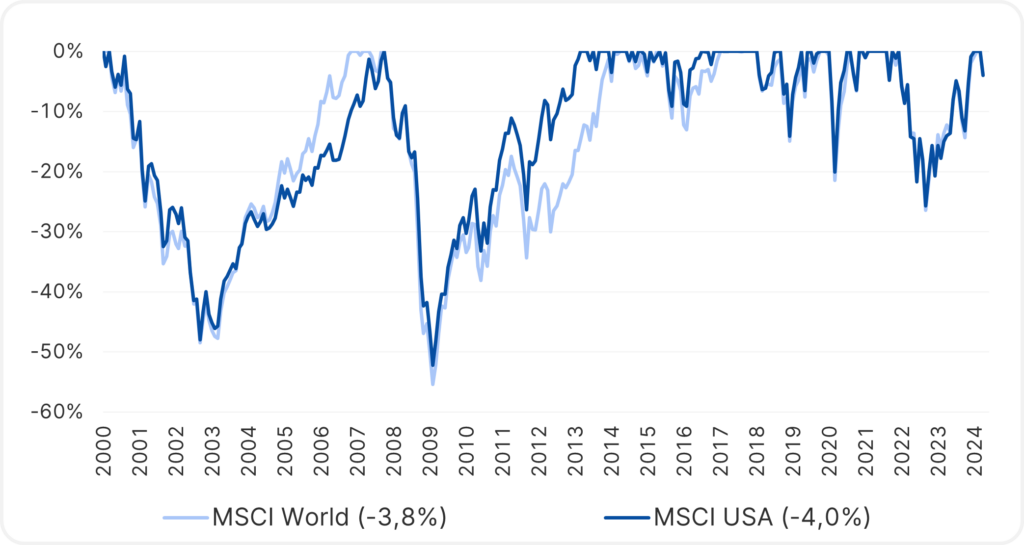
Source: Bloomberg; Erste AM Multi_Asset_Chartbook
Conclusion
There are no completely reliable indicators for recognizing turning points on the stock markets in advance, but there are a number of charts that can provide clues.
Note: Please note that investing in securities involves risks as well as opportunities.